
Intelligence · Market and competitive intelligence
Consumer Intelligence From Survey and Behavioural Data
Consumer intelligence combines what people say in surveys with what they do in purchases, searches and clicks. This article explains the strengths and limits of each source, the errors that affect them and how to combine them into reliable insight.
Organisations that sell to consumers have never had more information about them. Every purchase, website visit, app session and search leaves a record. At the same time, surveys remain the main way to learn what consumers think, need and intend. Consumer intelligence is the work of turning both kinds of information into understanding that supports decisions about products, pricing, communication and service. Each source has characteristic strengths and characteristic errors, and the most reliable insight comes from using them together. This article explains what each source can and cannot tell you, the errors to watch for and how to combine them.
Designed data and found data
Groves (2011) described the history of survey research in three eras. In the first, from the 1930s to the 1960s, the basic methods of probability sampling and questionnaire design were invented. In the second, surveys expanded rapidly, supported by the telephone and computers. In the third, which began around 1990, response rates fell and a new kind of data emerged: records produced as a by-product of everyday activity, which Groves called organic data, in contrast to the designed data of surveys. Salganik (2018) uses similar terms, distinguishing between data that researchers create for a purpose ("custommades") and data that already exist for some other purpose ("readymades").
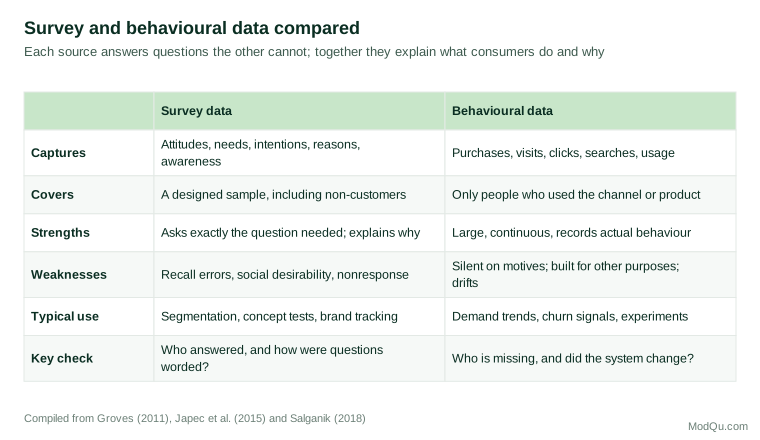
The distinction matters because the two types fail in different ways. A survey is designed to answer a specific question for a defined population, but it relies on people agreeing to take part and reporting accurately. Behavioural data record what actually happened, often for millions of people, but they were collected for operational purposes, cover only those who used a particular channel and say nothing directly about motives.
What surveys contribute
Surveys are the only practical way to learn many things that matter to businesses: why people choose one brand over another, which needs are unmet, how aware they are of a product, what they think of a price, and what they intend to do. They can also reach people who are not yet customers, which behavioural data held by a firm cannot.
Sources of survey error
Survey methodologists organise the possible errors in a survey into a framework known as total survey error (Groves et al., 2009; Groves & Lyberg, 2010). It separates errors of representation, which affect who is measured, from errors of measurement, which affect the answers they give.
On the representation side, the main risks are:
- Coverage error: the list or panel from which people are drawn may exclude parts of the population.
- Sampling error: the random variation that arises because only a sample is measured.
- Nonresponse error: people who take part may differ from those who do not.
- Adjustment error: weighting may correct some differences but introduce others.
On the measurement side, Tourangeau et al. (2000) describe answering a question as four steps: understanding the question, retrieving relevant memories, forming a judgement and reporting an answer. Errors can arise at each step. Krosnick (1991) showed that respondents who lack motivation or find a task difficult often satisfice: they give an answer that seems acceptable rather than the best one, for example by agreeing with statements, choosing the first reasonable option or giving the same rating to every item. Tourangeau and Yan (2007) reviewed evidence that people misreport on sensitive topics in the direction that makes them look better, and that self-administered questionnaires, including online surveys, reduce this tendency compared with interviews.
Non-probability samples
Many commercial surveys today use online panels or other samples that are not drawn by probability methods. Baker et al. (2013), reporting for the American Association for Public Opinion Research, concluded that such samples can be useful but that their accuracy depends on assumptions and adjustment models, which must be stated and tested. Comparing results with known benchmarks, such as census figures or a firm's own sales, is the best check.
The intention–behaviour gap
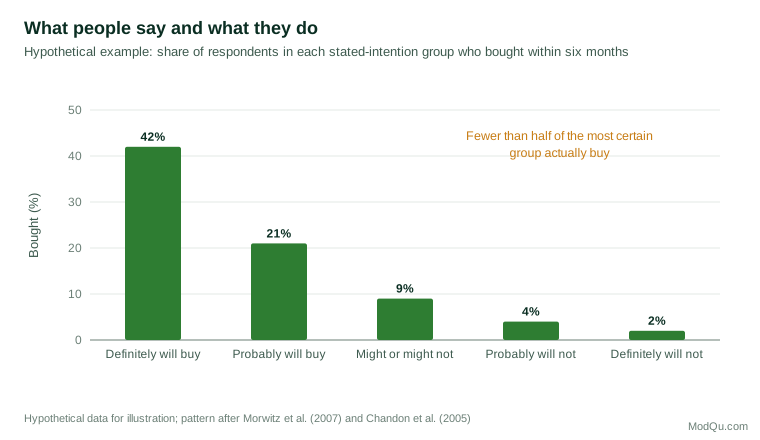
One of the most important limits of survey data concerns intentions. People are often asked whether they plan to buy a product, switch a supplier or try a new service. Their answers are informative but imperfect. Sheeran (2002), reviewing meta-analyses across many behaviours, found that intentions explained on average about a quarter of the variation in behaviour, and that a substantial share of people who intend to act do not follow through.
Morwitz et al. (2007) studied when purchase intentions predict sales. Intentions were more accurate for existing products than for new ones, for durable goods than for everyday items, over short time horizons than long ones, and when people were asked about specific brands rather than whole product categories. Chandon et al. (2005) added a subtle complication: simply asking people about their intentions can change their behaviour, so that surveyed customers behave differently from those who were not asked.
The gap is widest where answers carry social approval. Auger and Devinney (2007) showed that consumers asked in a standard survey said they cared a great deal about ethical product features, but in choice experiments that forced trade-offs against price and quality, those features mattered much less. Carrington et al. (2010) examined why consumers who intend to buy ethically often do not, pointing to habits, situational factors and the absence of firm plans.
The practical lesson is not that intention questions are useless. They rank people well: those who say they will definitely buy are far more likely to do so than those who say they will not. But the raw percentages overstate demand and should be calibrated against past ratios of intention to purchase.
Single-number metrics
Many firms track a single survey measure of customer loyalty, such as the likelihood of recommending the company to a friend. These measures are simple to collect and communicate. Keiningham et al. (2007), however, found in a longitudinal study that one widely promoted recommendation measure did not predict company growth better than other satisfaction and loyalty measures. Single numbers are useful for tracking, but the reasons behind them, which require further questions, usually matter more.
What behavioural data contribute
Behavioural data record actions rather than reports of actions. Purchase histories, loyalty card transactions, website and app logs, search queries and location data can show what people actually do, in great detail and almost continuously. Einav and Levin (2014) describe how such data, often generated by private firms, have opened new possibilities for measuring economic activity and studying behaviour that surveys could capture only roughly.
For businesses, behavioural data support many practical analyses. Purchase histories can be summarised by recency, frequency and monetary value, which Fader et al. (2005) linked to customer lifetime value. Web and app data reveal where customers abandon a process. Search data can show rising interest in a product category before sales respond.
Controlled experiments
Behavioural data are particularly powerful when combined with experiments. Kohavi et al. (2009) describe how online firms run controlled experiments, randomly showing different versions of a page or offer to different users and measuring the effect on behaviour. Randomisation solves a problem that observational data cannot: it separates the effect of a change from everything else that differs between groups. Experiments answer questions of the form "what happens if we do this?" far more reliably than surveys or analysis of past behaviour alone.
The limits of behavioural data
Salganik (2018) lists characteristics that make readymade data hard to use well. They are often incomplete, lacking demographic details or the variables a question requires; non-representative, covering only users of a particular platform; drifting, because the population, the behaviour and the system that records it all change over time; and algorithmically confounded, because the platform's own design shapes what people do. They may also be dirty, containing activity by automated programs, duplicates and errors.
The story of Google Flu Trends illustrates these problems. Ginsberg et al. (2009) showed that search queries about influenza symptoms could estimate flu activity in the United States faster than official surveillance. A few years later, Lazer et al. (2014) found that the system had substantially overestimated flu prevalence in several seasons. Among the causes were changes in the search engine itself, which altered what people searched for, and a model that had picked up search terms correlated with flu season by chance. They called the problem "big data hubris": the assumption that large volumes of found data can replace, rather than supplement, traditional measurement.
Japec et al. (2015), in another report for the American Association for Public Opinion Research, argued that the total survey error framework can be extended to big data. Coverage, selection and measurement errors still exist; they are simply less visible because no one designed the data collection.
Privacy
Behavioural data are often personal. Acquisti et al. (2015) show that people's concern about privacy depends heavily on context and that they often find it hard to judge what they are revealing. Collecting and combining behavioural data therefore carries legal duties and reputational risk. Good practice is to collect only what a question requires, aggregate where possible, explain clearly how data are used and respect customers' choices.
Practical steps for better survey data
Much survey error can be reduced at the design stage. Drawing on the response process described by Tourangeau et al. (2000) and the advice in Groves et al. (2009), the following steps are worth applying to any consumer survey:
- Ask about specific, recent behaviour. "How many times did you buy coffee away from home in the past seven days?" is easier to answer accurately than "How often do you usually buy coffee?"
- Ask about specific choices. Intentions to buy a named product within a stated period predict better than general interest in a category (Morwitz et al., 2007).
- Force realistic trade-offs. Choice questions that set features against price reveal priorities better than rating every feature separately, as Auger and Devinney (2007) showed.
- Keep it short and varied. Long grids of similar items invite satisficing (Krosnick, 1991). Shorter questionnaires and a mix of question types keep attention.
- Test the questions. A small pilot, with a few respondents asked to explain how they understood each question, catches ambiguous wording before the main survey.
- Record the details. Keep the exact wording, the order of questions, the dates of fieldwork and the sample source, so that results can be compared over time.
Combining the two
Because survey and behavioural data fail in different ways, they are most valuable together. Couper (2017) describes a range of new approaches that link the two, such as asking survey respondents for permission to connect their answers to transaction records, or using sensors and apps alongside questionnaires. Several combinations are useful in practice:
- Explaining behaviour. Behavioural data show that a group of customers has stopped buying; a survey of that group explains why.
- Validating surveys. Comparing stated purchases or intentions with recorded behaviour shows how far survey answers can be trusted and allows calibration.
- Filling gaps. Surveys reach non-customers and capture attitudes; behavioural data provide detail and timeliness.
- Designing experiments. Survey findings suggest what to change; experiments test whether the change works.
- Weighting and benchmarking. Known totals from sales or administrative records can be used to check and adjust survey estimates.
Common mistakes
Several errors recur in consumer intelligence work:
- Reading intention percentages as forecasts. Without calibration, stated intentions overstate demand, sometimes by a large margin.
- Treating customers as consumers. A firm's behavioural data describe its own customers. Conclusions about the whole market need data that include non-customers.
- Ignoring who answered. A survey with a low response rate or an unbalanced panel may describe engaged respondents rather than the population.
- Mistaking volume for accuracy. Large behavioural data sets reduce random error but not bias. A biased estimate from millions of records is still biased.
- Changing the instrument without noticing. A new question wording, a redesigned website or a changed tracking script can create apparent trends that are artefacts of measurement.
- Asking leading or vague questions. Questions that suggest an answer, combine two issues or use unfamiliar terms produce answers that cannot be interpreted.
An illustration
A home appliance brand plans to launch a more expensive, energy-efficient washing machine. An online survey of recent and prospective buyers finds that 38 per cent say they would definitely or probably pay the higher price. Taken at face value, the figure suggests strong demand.
The intelligence team does three things before reporting. First, it checks the survey sample against the brand's sales records and national household data, and weights the results to correct for an over-representation of younger, urban, higher-income respondents. Second, it applies conversion ratios from previous launches, in which only about a third of those stating firm intentions bought within a year. Third, it examines behavioural data from its website, which show that visitors who use the energy-cost calculator are twice as likely to choose the more efficient models in an existing range.
The combined estimate of demand is considerably lower than the raw survey figure, but more credible. The behavioural finding also suggests a practical step: make running-cost comparisons prominent at the point of sale. The brand tests this in a randomised experiment on its website before the launch, and the test confirms a measurable increase in choice of efficient models.
Conclusion
Consumer intelligence draws on two kinds of evidence. Surveys reveal attitudes, needs and intentions, and can reach the whole market, but are subject to errors of representation and measurement and to the gap between what people say and what they do. Behavioural data record actual actions in great volume, but cover only some people, change over time and say little about motives. Treating either source as complete leads to mistakes. Combining them, checking each against the other and testing conclusions through experiments produces consumer intelligence that is both explanatory and reliable.
References
Acquisti, A., Brandimarte, L., & Loewenstein, G. (2015). Privacy and human behavior in the age of information. Science, 347(6221), 509–514. https://doi.org/10.1126/science.aaa1465
Auger, P., & Devinney, T. M. (2007). Do what consumers say matter? The misalignment of preferences with unconstrained ethical intentions. Journal of Business Ethics, 76(4), 361–383. https://doi.org/10.1007/s10551-006-9287-y
Baker, R., Brick, J. M., Bates, N. A., Battaglia, M., Couper, M. P., Dever, J. A., Gile, K. J., & Tourangeau, R. (2013). Summary report of the AAPOR task force on non-probability sampling. Journal of Survey Statistics and Methodology, 1(2), 90–143. https://doi.org/10.1093/jssam/smt008
Carrington, M. J., Neville, B. A., & Whitwell, G. J. (2010). Why ethical consumers don't walk their talk: Towards a framework for understanding the gap between the ethical purchase intentions and actual buying behaviour of ethically minded consumers. Journal of Business Ethics, 97(1), 139–158. https://doi.org/10.1007/s10551-010-0501-6
Chandon, P., Morwitz, V. G., & Reinartz, W. J. (2005). Do intentions really predict behavior? Self-generated validity effects in survey research. Journal of Marketing, 69(2), 1–14. https://doi.org/10.1509/jmkg.69.2.1.60755
Couper, M. P. (2017). New developments in survey data collection. Annual Review of Sociology, 43, 121–145. https://doi.org/10.1146/annurev-soc-060116-053613
Einav, L., & Levin, J. (2014). Economics in the age of big data. Science, 346(6210), Article 1243089. https://doi.org/10.1126/science.1243089
Fader, P. S., Hardie, B. G. S., & Lee, K. L. (2005). RFM and CLV: Using iso-value curves for customer base analysis. Journal of Marketing Research, 42(4), 415–430. https://doi.org/10.1509/jmkr.2005.42.4.415
Ginsberg, J., Mohebbi, M. H., Patel, R. S., Brammer, L., Smolinski, M. S., & Brilliant, L. (2009). Detecting influenza epidemics using search engine query data. Nature, 457(7232), 1012–1014. https://doi.org/10.1038/nature07634
Groves, R. M., & Lyberg, L. (2010). Total survey error: Past, present, and future. Public Opinion Quarterly, 74(5), 849–879. https://doi.org/10.1093/poq/nfq065
Groves, R. M. (2011). Three eras of survey research. Public Opinion Quarterly, 75(5), 861–871. https://doi.org/10.1093/poq/nfr057
Groves, R. M., Fowler, F. J., Jr., Couper, M. P., Lepkowski, J. M., Singer, E., & Tourangeau, R. (2009). Survey methodology (2nd ed.). Wiley.
Japec, L., Kreuter, F., Berg, M., Biemer, P., Decker, P., Lampe, C., Lane, J., O'Neil, C., & Usher, A. (2015). Big data in survey research: AAPOR task force report. Public Opinion Quarterly, 79(4), 839–880. https://doi.org/10.1093/poq/nfv039
Keiningham, T. L., Cooil, B., Andreassen, T. W., & Aksoy, L. (2007). A longitudinal examination of net promoter and firm revenue growth. Journal of Marketing, 71(3), 39–51. https://doi.org/10.1509/jmkg.71.3.039
Kohavi, R., Longbotham, R., Sommerfield, D., & Henne, R. M. (2009). Controlled experiments on the web: Survey and practical guide. Data Mining and Knowledge Discovery, 18(1), 140–181. https://doi.org/10.1007/s10618-008-0114-1
Krosnick, J. A. (1991). Response strategies for coping with the cognitive demands of attitude measures in surveys. Applied Cognitive Psychology, 5(3), 213–236. https://doi.org/10.1002/acp.2350050305
Lazer, D., Kennedy, R., King, G., & Vespignani, A. (2014). The parable of Google Flu: Traps in big data analysis. Science, 343(6176), 1203–1205. https://doi.org/10.1126/science.1248506
Morwitz, V. G., Steckel, J. H., & Gupta, A. (2007). When do purchase intentions predict sales? International Journal of Forecasting, 23(3), 347–364. https://doi.org/10.1016/j.ijforecast.2007.05.015
Salganik, M. J. (2018). Bit by bit: Social research in the digital age. Princeton University Press.
Sheeran, P. (2002). Intention–behavior relations: A conceptual and empirical review. European Review of Social Psychology, 12(1), 1–36. https://doi.org/10.1080/14792772143000003
Tourangeau, R., & Yan, T. (2007). Sensitive questions in surveys. Psychological Bulletin, 133(5), 859–883. https://doi.org/10.1037/0033-2909.133.5.859
Tourangeau, R., Rips, L. J., & Rasinski, K. (2000). The psychology of survey response. Cambridge University Press. https://doi.org/10.1017/CBO9780511819322