
Intelligence · Analysis and tradecraft
Superforecasting: What Research Says About Accurate Prediction
What a decade of forecasting tournaments revealed about who predicts well, how accuracy is measured, and which habits make forecasts better.
Organisations make forecasts constantly, whether they call them that or not. A product launch assumes a level of demand; a hiring plan assumes a rate of growth; a risk register assumes that some events are more likely than others. For most of history, the accuracy of such judgements was rarely measured. Research on "superforecasting" changed that by treating prediction as a skill that can be scored, studied and improved.
From expert judgement to measured accuracy
The starting point was Philip Tetlock's long study of expert political judgement. Over many years he collected thousands of predictions from academics, government officials and commentators about political and economic events, then scored them once the outcomes were known. The results were humbling. On average, experts did little better than simple statistical rules, and those with the most confident, single-theory view of the world tended to do worst. Experts who drew on many sources, doubted their own conclusions and adjusted readily, whom Tetlock called "foxes", were more accurate than "hedgehogs" who knew one big thing (Tetlock, 2005).
This work raised an obvious question: if most expert forecasting is mediocre, can anyone do it well, and can it be taught?
The forecasting tournament
From 2011 the U.S. Intelligence Advanced Research Projects Activity (IARPA) ran a multi-year geopolitical forecasting tournament. Research teams competed to produce the most accurate probabilities on hundreds of real questions, such as whether a given leader would leave office by a certain date. The Good Judgment Project, led by Tetlock and Barbara Mellers, recruited thousands of volunteer forecasters and ran experiments inside the tournament to find out what improved accuracy (Tetlock & Gardner, 2015).
Mellers et al. (2014) reported that three interventions made a measurable difference: a short training module in probabilistic reasoning, placing forecasters in teams where they could share evidence and challenge each other, and tracking the best performers. Mellers et al. (2015) then examined the top 2% of forecasters in each year. When these "superforecasters" were grouped into elite teams, their accuracy did not drift back towards the average, as would be expected if they had simply been lucky. It held up or improved, which suggests real skill.
How accuracy is scored
Forecasting research depends on a scoring rule that rewards both being right and being appropriately confident. The most widely used is the Brier score, introduced for weather forecasts (Brier, 1950). In its simplest form for a yes/no question, it is the squared difference between the forecast probability and the outcome, coded 1 if the event happened and 0 if it did not. Lower is better. A forecaster who always says 50% scores 0.25 on every question, regardless of what happens. Confident correct forecasts score close to 0; confident wrong ones are punished heavily. (Brier's original formulation sums the error across both outcomes, giving a range of 0 to 2; many studies use this version, so scores should always be compared on the same scale.)
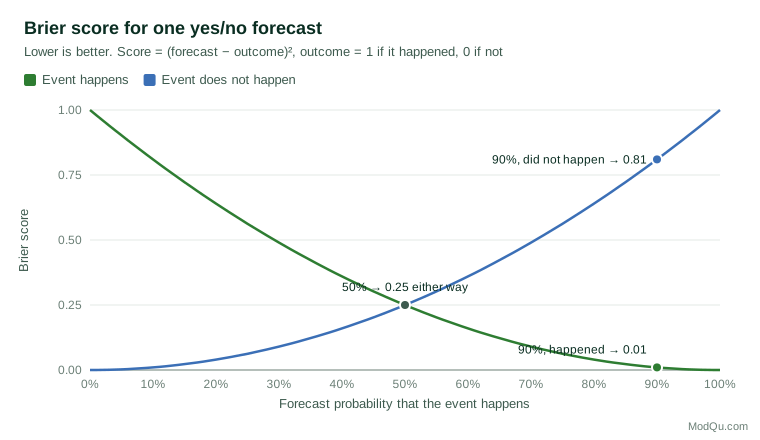
A short example shows how the score separates forecasters. Two analysts each forecast four product launches. Analyst A gives every launch a 50% chance of meeting its target and scores 0.25 on each, an average of 0.25. Analyst B gives probabilities of 80%, 70%, 20% and 90%; the first, second and fourth launches succeed and the third fails. B's scores are 0.04, 0.09, 0.04 and 0.01, an average of 0.045. B was not certain about anything, but was consistently confident in the right direction, and the score rewards exactly that. Had B said 90% for the launch that failed, that single forecast would have cost 0.81, wiping out much of the advantage. The scoring rule makes overconfidence expensive and vagueness unrewarding.
Because the score is calculated over many questions, it rewards calibration (events forecast at 70% should happen about 70% of the time) and resolution (forecasts should move away from 50% when the evidence allows); Murphy (1973) showed how the score divides into these components.
What superforecasters do differently
Tetlock and Gardner (2015) summarise the habits observed among the most accurate forecasters. None of them requires special access to secret information:
- Break questions down. Split a hard question into smaller parts whose likelihood can be estimated separately.
- Start with the base rate. Before considering the details of a case, ask how often events of this kind happen in general, then adjust. Kahneman and Lovallo (1993) call this taking the "outside view".
- Think in fine-grained probabilities. Distinguish between 60% and 70%, rather than treating everything as "likely" or "unlikely".
- Update often, in small steps. Revise forecasts as new information arrives, without overreacting to each headline.
- Seek out disagreement. Look for evidence and arguments against the current view, and work with others who will challenge it.
- Review results. Keep score, study errors and treat forecasting as a skill to practise.
Combining many forecasts
The tournament also showed that how individual judgements are combined matters as much as who makes them. Satopää et al. (2014) found that averaging forecasts and then "extremising" the average, pushing it slightly further from 50%, improved accuracy, because each forecaster holds only part of the available information. Galton (1907) saw an early version of this effect: the median of 787 guesses of an ox's weight came within 1% of the true figure. Atanasov et al. (2017) compared prediction markets with "prediction polls", in which forecasters simply submit probabilities, and found that polls with teams and statistical aggregation were at least as accurate as markets.
Lessons for business intelligence
The research has direct value for organisations that rely on market and customer intelligence. Forecasts should be stated as numerical probabilities rather than vague words, recorded and later scored. When Mandel and Barnes (2014) scored the forecasts of Canadian intelligence analysts, they found them well calibrated, and Tetlock et al. (2014) argue that such tournaments make debates more transparent. Teams that pool and challenge judgements do better than lone experts. And the starting point for any forecast about customer behaviour should be a base rate drawn from good data, such as the share of past survey respondents who followed through on a stated intention, before the details of a new situation are considered.
Limits
Superforecasting works best for well-defined questions that resolve within months to a year or two. It is less tested on rare, long-range or poorly defined events, and accuracy scores say little about whether the right questions were asked in the first place. Tetlock and Gardner (2015) acknowledge these limits. There is also a risk that scoring changes behaviour in unhelpful ways: forecasters who are judged only on accuracy may prefer easy questions to important ones. Organisations that adopt forecasting should therefore decide carefully which questions are worth forecasting, and keep a mix of short-term questions that build skill and longer-term questions that matter for strategy. Measured forecasting is therefore a complement to scenario planning and expert analysis, not a replacement for them.
References
Atanasov, P., Rescober, P., Stone, E., Swift, S. A., Servan-Schreiber, E., Tetlock, P., Ungar, L., & Mellers, B. (2017). Distilling the wisdom of crowds: Prediction markets vs. prediction polls. Management Science, 63(3), 691–706. https://doi.org/10.1287/mnsc.2015.2374
Brier, G. W. (1950). Verification of forecasts expressed in terms of probability. Monthly Weather Review, 78(1), 1–3. https://doi.org/10.1175/1520-0493(1950)078<0001:VOFEIT>2.0.CO;2
Galton, F. (1907). Vox populi. Nature, 75(1949), 450–451. https://doi.org/10.1038/075450a0
Kahneman, D., & Lovallo, D. (1993). Timid choices and bold forecasts: A cognitive perspective on risk taking. Management Science, 39(1), 17–31. https://doi.org/10.1287/mnsc.39.1.17
Mandel, D. R., & Barnes, A. (2014). Accuracy of forecasts in strategic intelligence. Proceedings of the National Academy of Sciences, 111(30), 10984–10989. https://doi.org/10.1073/pnas.1406138111
Mellers, B., Stone, E., Murray, T., Minster, A., Rohrbaugh, N., Bishop, M., Chen, E., Baker, J., Hou, Y., Horowitz, M., Ungar, L., & Tetlock, P. (2015). Identifying and cultivating superforecasters as a method of improving probabilistic predictions. Perspectives on Psychological Science, 10(3), 267–281. https://doi.org/10.1177/1745691615577794
Mellers, B., Ungar, L., Baron, J., Ramos, J., Gurcay, B., Fincher, K., Scott, S. E., Moore, D., Atanasov, P., Swift, S. A., Murray, T., Stone, E., & Tetlock, P. E. (2014). Psychological strategies for winning a geopolitical forecasting tournament. Psychological Science, 25(5), 1106–1115. https://doi.org/10.1177/0956797614524255
Murphy, A. H. (1973). A new vector partition of the probability score. Journal of Applied Meteorology, 12(4), 595–600. https://doi.org/10.1175/1520-0450(1973)012<0595:ANVPOT>2.0.CO;2
Satopää, V. A., Baron, J., Foster, D. P., Mellers, B. A., Tetlock, P. E., & Ungar, L. H. (2014). Combining multiple probability predictions using a simple logit model. International Journal of Forecasting, 30(2), 344–356. https://doi.org/10.1016/j.ijforecast.2013.09.009
Tetlock, P. E. (2005). Expert political judgment: How good is it? How can we know? Princeton University Press.
Tetlock, P. E., & Gardner, D. (2015). Superforecasting: The art and science of prediction. Crown.
Tetlock, P. E., Mellers, B. A., Rohrbaugh, N., & Chen, E. (2014). Forecasting tournaments: Tools for increasing transparency and improving the quality of debate. Current Directions in Psychological Science, 23(4), 290–295. https://doi.org/10.1177/0963721414534257