
Intelligence · Analysis and tradecraft
"Quantitative Methods in Intelligence Analysis: Trend Extrapolation and Modeling"
Quantitative methods, from simple trend extrapolation to statistical and simulation models, can make intelligence forecasts more accurate and more transparent. This article explains the main methods, what forecasting competitions reveal about which work best, how models have been used in political and business intelligence, and their limits.
Much intelligence analysis is qualitative: reading reports, weighing sources and forming judgements. But many intelligence questions have a quantitative core. How fast is a market growing? How many units will a competitor produce next year? How likely is political instability in a given country? For such questions, quantitative methods can make forecasts more accurate, more consistent and easier to check. This article explains the main methods, from simple trend extrapolation to statistical and simulation models, reviews what research shows about their accuracy, and discusses how they should be combined with expert judgement.
Why use quantitative methods?
Research on judgement provides a strong case. Dawes et al. (1989) reviewed decades of studies comparing expert judgement with simple statistical models and found that the models usually performed at least as well, and often better. Tetlock (2005), studying thousands of political and economic forecasts, found that experts were often outperformed by simple extrapolation rules. Kahneman et al. (2021) explain part of the reason: human judgements are noisy, varying from one expert to another and from one occasion to the next, while a model gives the same answer every time it is given the same information.
Quantitative methods also make reasoning visible. A model states its assumptions explicitly, so others can examine and challenge them. Heuer (1999) argued that analysts' mental models are often implicit and therefore hard to test; a formal model brings at least part of that reasoning into the open.
Base rates: the simplest model
Before building any model, analysts can ask a simple quantitative question: how often has this kind of event happened before? A base rate drawn from comparable cases is itself a model, and often a surprisingly good one. If a third of new entrants in an industry leave within three years, that figure is a sensible starting point for judging a particular entrant's prospects, before considering what makes this case different. Tetlock (2005) found that forecasters who anchored on such comparison classes and adjusted cautiously tended to outperform those who reasoned only from the details of the case. Kahneman et al. (2021) recommend the same approach as a way of reducing both bias and noise.
Trend extrapolation
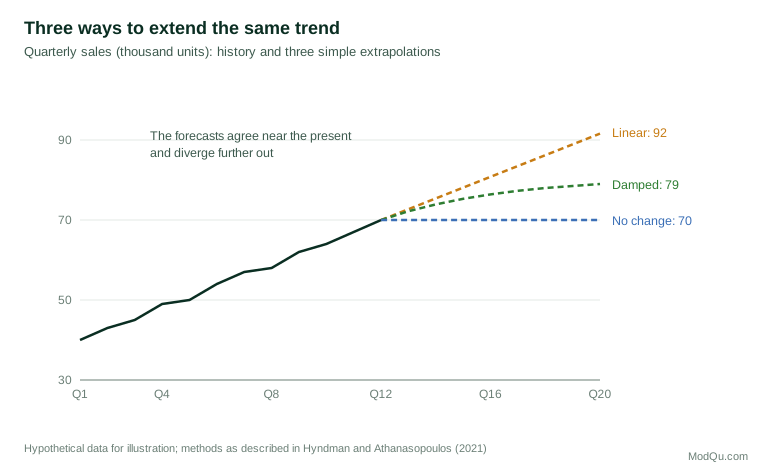
The simplest quantitative forecast extends a past pattern into the future. Hyndman and Athanasopoulos (2021), in a widely used textbook, describe several basic methods:
- No change (the naive method): the forecast is the last observed value.
- Seasonal no change: the forecast is the value from the same season last year.
- Linear trend: a straight line fitted to past data is extended forward.
- Damped trend: the trend is extended but gradually flattened, on the assumption that growth will slow.
- Exponential smoothing: recent observations are weighted more heavily than older ones, with separate components for level, trend and seasonality.
More elaborate time-series methods, such as the ARIMA models developed by Box and Jenkins, describe how each value depends on previous values and on past random shocks (Box et al., 2015). They can capture more complex patterns but require more data and more skill to use well.
Every extrapolation rests on an assumption: that the forces which produced the past pattern will continue. This is often reasonable in the short term and increasingly doubtful in the long term. Good practice is to report a range, not a single number. Hyndman and Athanasopoulos (2021) stress that prediction intervals, showing the range within which the outcome is likely to fall, are as important as the central forecast.
What forecasting competitions show
Since the 1980s, Spyros Makridakis and colleagues have run a series of forecasting competitions in which many methods are tested on large numbers of real time series. The results have been consistent and somewhat surprising.
In the M3 competition, involving 3,003 series, Makridakis and Hibon (2000) found that statistically sophisticated methods did not necessarily produce more accurate forecasts than simpler ones, that combining the forecasts of several methods improved accuracy, and that the best method depended on the type of data and the forecast horizon. Makridakis et al. (2018) later tested machine learning methods on the same data and found that they were generally less accurate than standard statistical methods, while requiring far more computation.
The M4 competition used 100,000 series and 61 methods. Makridakis et al. (2020) found that the most accurate approaches were combinations of methods and hybrids that blended statistical models with machine learning. Pure machine learning methods again performed poorly. The best methods also produced better-calibrated prediction intervals.
These findings support principles set out by Armstrong (2001) in a handbook drawing on decades of forecasting research: prefer simple methods unless there is evidence that complex ones work better; combine forecasts from different methods; damp trends when uncertainty is high; and test methods on past data before relying on them.
Explaining versus predicting
Shmueli (2010) drew an important distinction between models built to explain and models built to predict. Explanatory models aim to identify causes and are judged by whether their estimates of effects are correct. Predictive models aim to forecast outcomes and are judged by their accuracy on new data. A model can be good at one and poor at the other. For intelligence, both matter: explanation helps analysts understand why something is happening and what might change it, while prediction helps decision-makers plan. Analysts should be clear which purpose a model serves and evaluate it accordingly.
Models of growth and diffusion
Some quantitative models are built around a theory of how a process works. In business intelligence, one of the most widely used is the Bass diffusion model for new products (Bass, 1969). It assumes that some buyers adopt a product because of external influence, such as advertising, and others because they imitate earlier adopters. The two forces together produce a characteristic S-shaped curve of cumulative adoption.
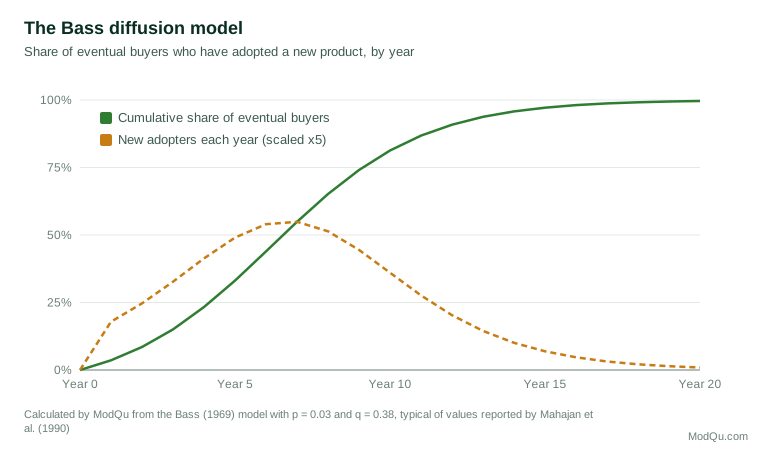
Mahajan et al. (1990) reviewed two decades of research on diffusion models and found that they described the adoption of many consumer and industrial products well. For intelligence purposes, such models are useful in two ways: to forecast how quickly a competitor's new product or a new technology will spread, and to recognise from early sales data where on the curve a product currently sits.
System dynamics and simulation
Forrester (1961) developed system dynamics to model how feedback loops, delays and accumulations shape the behaviour of organisations over time. Forrester's models showed, for example, how delays in ordering and shipping cause production to swing far more widely than customer demand. Sterman (1989) used a simple simulated supply chain, the "beer game", to show that experienced managers consistently misjudge such systems, ordering too much and then too little, because they fail to account for delays and feedback.
The best-known application of system dynamics is The Limits to Growth (Meadows et al., 1972), which modelled the interaction of world population, industrial output, resources and pollution under different assumptions. The study was controversial, but it showed how simulation can explore the long-term consequences of current trends and policies. For intelligence analysts, simulation is useful for questions where feedback and delay matter: supply chains, arms races, market competition and the spread of crises.
Political forecasting models
Government agencies have developed statistical models to forecast political events. Goldstone et al. (2010), working for the American Political Instability Task Force, built a model using only four variables, including the type of political regime and the presence of armed conflict in neighbouring states, that correctly anticipated most onsets of serious instability two years ahead in historical tests. The model's simplicity was part of its value: it was transparent and could be explained to decision-makers.
O'Brien (2010) described the Integrated Crisis Early Warning System, a programme funded by the American defence research agency that combined statistical models and automated coding of news reports to forecast events such as rebellions and international crises. O'Brien found that such models could match or improve on expert forecasts for some types of event and argued that they were most useful as a complement to human analysis.
Limits of quantitative methods
Quantitative methods have important limitations.
All models simplify. Box (1976) reminded statisticians that every model is an approximation and that excessive elaboration does not make a model correct; the question is whether it is useful for its purpose.
Past patterns break. Extrapolation assumes continuity, but the most consequential events are often discontinuities. Taleb (2007) argued that rare, high-impact events dominate history and are poorly captured by models built on past data.
Data may be poor. Intelligence data are often incomplete, inconsistent or deliberately distorted. A sophisticated model applied to weak data can produce precise-looking but unreliable results.
Numbers can create false confidence. A forecast of 63,400 units sounds more certain than "between 55,000 and 72,000", even if the second is more honest. Reporting ranges and stating assumptions helps.
Combining models and judgement
The evidence does not suggest replacing analysts with models. It suggests using each where it is strongest. Models provide consistency, transparency and a disciplined starting point. Analysts provide knowledge of context, awareness of changes the model cannot see and judgement about whether the model's assumptions still hold.
A practical approach is to start with a simple model, such as a damped trend or a base rate from comparable cases, and then adjust it only for specific, documented reasons. Armstrong (2001) found that such structured adjustments improve forecasts, while unstructured adjustments often make them worse. Combining a model forecast with an independent expert forecast, and recording both, also allows an organisation to learn over time which performs better.
Common mistakes
- Fitting the past too closely. A model with many parameters can match historical data almost perfectly and still forecast poorly.
- Using one method only. Combining several simple methods is usually safer than relying on one sophisticated method (Makridakis & Hibon, 2000).
- Reporting a single number. Without a range, readers cannot judge how much to trust the forecast.
- Never checking accuracy. Forecasts should be recorded and compared with outcomes, so that methods can be improved.
- Ignoring how the data were produced. Changes in how figures are collected or defined can create apparent trends that do not exist, or hide ones that do. Analysts should check that a series measures the same thing throughout before extending it.
An illustration
A Canadian company that makes heat pumps wants to forecast demand over the next five years. The analysis team starts with three simple extrapolations of past sales, which differ widely after the second year. It then fits a Bass diffusion model to sales since the product was introduced, which suggests the market is approaching the steepest part of its growth curve. A system dynamics model of the supply chain shows that, if demand rises as forecast, lead times for a key component will lengthen sharply within eighteen months.
The team presents a central forecast with a range, explains which assumptions drive the range, including government incentive programmes that could end, and recommends securing additional component supply early. It also records the forecast so that accuracy can be checked each year and the model improved.
Conclusion
Quantitative methods give intelligence analysts tools that are consistent, transparent and, on many questions, more accurate than unaided judgement. Forecasting competitions show that simple methods and combinations of methods often outperform complex ones. Diffusion and system dynamics models help analysts understand how growth and feedback shape outcomes, and statistical models have been applied successfully to political instability. All models simplify and can fail when patterns break. The most effective practice combines models with expert judgement, reports ranges rather than single numbers and tracks accuracy over time.
References
Armstrong, J. S. (Ed.). (2001). Principles of forecasting: A handbook for researchers and practitioners. Kluwer Academic.
Bass, F. M. (1969). A new product growth for model consumer durables. Management Science, 15(5), 215–227. https://doi.org/10.1287/mnsc.15.5.215
Box, G. E. P. (1976). Science and statistics. Journal of the American Statistical Association, 71(356), 791–799. https://doi.org/10.1080/01621459.1976.10480949
Box, G. E. P., Jenkins, G. M., Reinsel, G. C., & Ljung, G. M. (2015). Time series analysis: Forecasting and control (5th ed.). Wiley.
Dawes, R. M., Faust, D., & Meehl, P. E. (1989). Clinical versus actuarial judgment. Science, 243(4899), 1668–1674. https://doi.org/10.1126/science.2648573
Forrester, J. W. (1961). Industrial dynamics. MIT Press.
Goldstone, J. A., Bates, R. H., Epstein, D. L., Gurr, T. R., Lustik, M. B., Marshall, M. G., Ulfelder, J., & Woodward, M. (2010). A global model for forecasting political instability. American Journal of Political Science, 54(1), 190–208. https://doi.org/10.1111/j.1540-5907.2009.00426.x
Heuer, R. J., Jr. (1999). Psychology of intelligence analysis. Center for the Study of Intelligence, Central Intelligence Agency.
Hyndman, R. J., & Athanasopoulos, G. (2021). Forecasting: Principles and practice (3rd ed.). OTexts.
Kahneman, D., Sibony, O., & Sunstein, C. R. (2021). Noise: A flaw in human judgment. Little, Brown Spark.
Mahajan, V., Muller, E., & Bass, F. M. (1990). New product diffusion models in marketing: A review and directions for research. Journal of Marketing, 54(1), 1–26. https://doi.org/10.1177/002224299005400101
Makridakis, S., & Hibon, M. (2000). The M3-competition: Results, conclusions and implications. International Journal of Forecasting, 16(4), 451–476. https://doi.org/10.1016/S0169-2070(00)00057-1
Makridakis, S., Spiliotis, E., & Assimakopoulos, V. (2018). Statistical and machine learning forecasting methods: Concerns and ways forward. PLOS ONE, 13(3), Article e0194889. https://doi.org/10.1371/journal.pone.0194889
Makridakis, S., Spiliotis, E., & Assimakopoulos, V. (2020). The M4 competition: 100,000 time series and 61 forecasting methods. International Journal of Forecasting, 36(1), 54–74. https://doi.org/10.1016/j.ijforecast.2019.04.014
Meadows, D. H., Meadows, D. L., Randers, J., & Behrens, W. W., III. (1972). The limits to growth. Universe Books.
O'Brien, S. P. (2010). Crisis early warning and decision support: Contemporary approaches and thoughts on future research. International Studies Review, 12(1), 87–104. https://doi.org/10.1111/j.1468-2486.2009.00914.x
Shmueli, G. (2010). To explain or to predict? Statistical Science, 25(3), 289–310. https://doi.org/10.1214/10-STS330
Sterman, J. D. (1989). Modeling managerial behavior: Misperceptions of feedback in a dynamic decision making experiment. Management Science, 35(3), 321–339. https://doi.org/10.1287/mnsc.35.3.321
Taleb, N. N. (2007). The black swan: The impact of the highly improbable. Random House.
Tetlock, P. E. (2005). Expert political judgment: How good is it? How can we know? Princeton University Press.