
Intelligence · Organisational intelligence
"Data-Driven Decision-Making: Evidence and Limits"
Organisations are urged to base decisions on data rather than intuition. This article reviews what the evidence actually shows about data-driven decision-making, where it clearly helps, where it fails, and how to combine data with judgement so that decisions improve rather than merely look more rigorous.
"In God we trust; all others must bring data." The saying, popular in management circles, captures a widely held view: decisions based on data are better than decisions based on intuition, experience or opinion. Over the past two decades, data-driven decision-making has become an aspiration for organisations of every kind. Companies have invested heavily in data collection, analytics teams and dashboards. Public services have adopted targets and performance indicators. The question is whether the investment has paid off, and under what conditions.
The evidence gives a mixed but instructive answer. Data-driven methods clearly improve decisions in some settings. In others, they fail badly, sometimes because the data are poor, sometimes because the measures distort behaviour, and sometimes because the future does not resemble the past. Understanding both sides is essential for anyone who produces or uses intelligence.
What data-driven decision-making means
Provost and Fawcett (2013) define data-driven decision-making as the practice of basing decisions on the analysis of data rather than purely on intuition. They emphasise that it is a matter of degree: most decisions combine data and judgement, and the question is how much weight each receives. They also distinguish decisions where data reveal something new from repeated decisions, such as which customers to target, where small improvements in accuracy add up across many cases.
Davenport (2006) described a group of companies that had made analytics central to their strategy, using data to make decisions about pricing, customer relationships, supply chains and human resources. Davenport and Harris (2007) developed the idea into a framework for "competing on analytics", arguing that organisations which build analytical capability into their culture and processes gain lasting advantage.
The case for data
Productivity evidence
The most cited evidence comes from economics. Brynjolfsson, Hitt and Kim (2011) surveyed large American firms about their use of data in decision-making and linked the answers to measures of performance. Firms that reported greater use of data-driven decision-making had higher productivity and market value than would be expected from their other investments. Brynjolfsson and McElheran (2016), using data from the United States Census Bureau on manufacturing plants, found that the adoption of data-driven decision-making had spread rapidly and was associated with significantly higher productivity.
McAfee and Brynjolfsson (2012) argued that the growth of data was creating a "management revolution", and that companies which used data well outperformed their competitors. LaValle et al. (2011), surveying thousands of executives, found that top-performing organisations were much more likely than lower performers to use analytics to guide both strategy and daily operations. They also found that the main barriers were not technical but managerial and cultural: knowing how to apply analytics to the business, and getting people to act on what it shows.
These studies are correlational. Firms that use data may differ from others in many ways, such as management quality, that also explain their performance. But the consistency of the findings across different methods and samples gives reasonable confidence that data use contributes to performance.
Statistical prediction versus expert judgement
A much older body of evidence compares predictions made by statistical rules with those made by experts. Meehl (1954) reviewed studies in clinical psychology and found that simple statistical formulas predicted outcomes such as academic success or response to treatment at least as well as clinicians, and often better. Dawes, Faust and Meehl (1989) reviewed later evidence and reached the same conclusion. Grove et al. (2000) conducted a meta-analysis of 136 studies across medicine, psychology, education and business. Mechanical prediction was about as accurate as or more accurate than clinical judgement in the large majority of studies, and clearly worse in only a few.
Kahneman, Sibony and Sunstein (2021) explain one reason: human judgements are noisy. The same expert, given the same case on different occasions, often reaches different conclusions, and different experts disagree widely. A statistical rule, whatever its flaws, gives the same answer to the same inputs. Removing noise alone often improves accuracy.
Experiments
Some of the strongest evidence for data comes from controlled experiments. Kohavi et al. (2009) describe how large online companies test changes to websites by randomly showing different versions to different users and measuring the results. They report that many ideas which managers and designers were confident would improve results did not, and that some ideas expected to fail succeeded. Experiments replace opinion about what will work with evidence about what does.
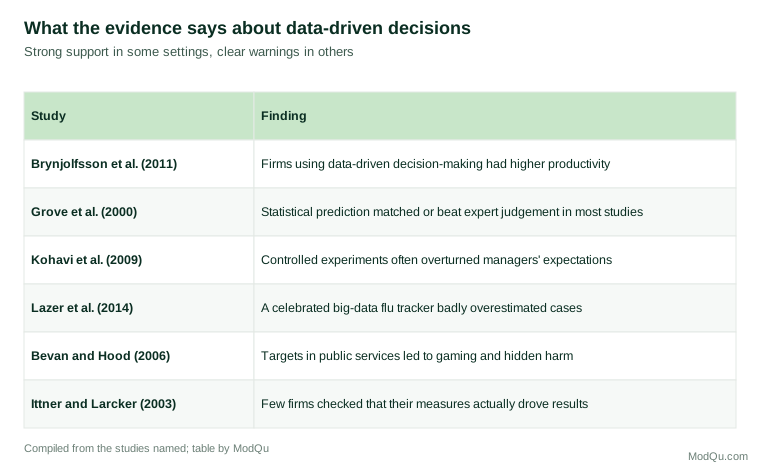
Figure 1 summarises key findings on both sides of the debate.
The limits of data
Bad data and big data
Data are only as good as the processes that produce them. Lazer et al. (2014) analysed Google Flu Trends, a widely praised system that estimated influenza levels from search queries. For a time it tracked official figures closely. Then it began to overestimate flu prevalence substantially, in one season predicting more than double the doctor visits for influenza-like illness reported by the Centers for Disease Control. The authors identified two problems. The system had been fitted to patterns in search data that were partly coincidental, and changes to the search engine itself altered the behaviour it measured. They called the assumption that large data sets can replace traditional data collection and analysis "big data hubris".
Measures that distort
When data are used to set targets or reward people, the act of measurement can change the behaviour it is meant to track. Campbell (1979) observed that the more any quantitative social indicator is used for social decision-making, the more subject it will be to corruption pressures and the more apt it will be to distort the processes it is intended to monitor. Kerr (1975) described the folly of rewarding one behaviour while hoping for another.
Bevan and Hood (2006) studied the use of targets in the English public health system. Waiting-time targets were met, but often through practices that defeated their purpose: patients were held in ambulances outside hospitals so that the clock would not start, or appointments were cancelled and rebooked. The data showed improvement; the reality was more complicated. Muller (2018) documents similar problems across education, policing, medicine and business, which Muller calls the "tyranny of metrics".
Measuring the wrong things
Ittner and Larcker (2003) studied how companies used non-financial performance measures such as customer satisfaction and employee engagement. Most companies had not established whether the measures they tracked actually drove financial results. Many chose measures because they were easy to collect or widely used, not because they mattered. Some firms that did test the links found that their assumptions were wrong. Data-driven management on unvalidated measures can lead decisions confidently in the wrong direction.
Correlation and causation
Most business data are observational, and the patterns they show do not necessarily reflect cause and effect. Pearl and Mackenzie (2018) explain why data alone cannot answer causal questions without assumptions about how the data were generated. A data analysis showing that customers who use a feature are more loyal does not show that encouraging use of the feature will increase loyalty; loyal customers may simply be more likely to explore features. Decisions require causal understanding, which needs experiments, careful reasoning or both.
Misreading statistics
Even accurate data can be misunderstood. Gigerenzer et al. (2007) showed that many doctors and patients misinterpret common health statistics, such as the meaning of a positive test result or a relative reduction in risk. The same confusions arise in business: a 50% rise in a small number, an average that hides wide variation, or a percentage without a base. Data-driven decisions require data-literate decision-makers.
Data and judgement
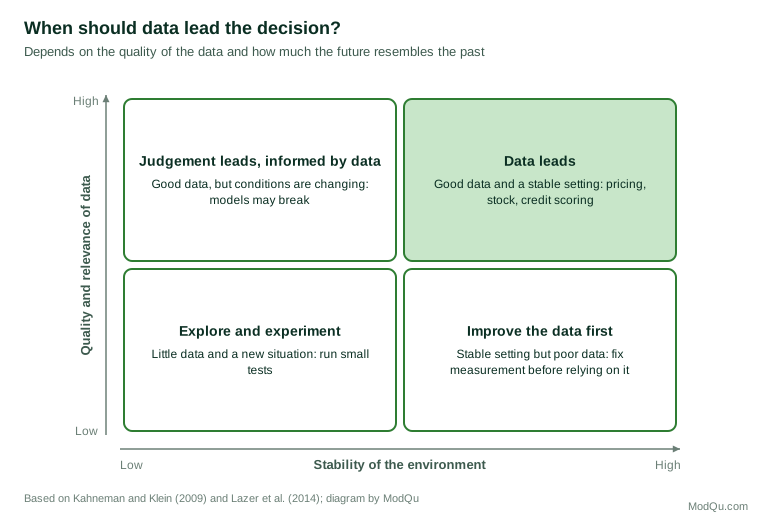
The evidence does not support replacing judgement with data. It supports combining them well. Kahneman and Klein (2009) identified the conditions under which expert intuition can be trusted: the environment must be regular enough to be learnable, and the expert must have had extensive practice with timely feedback. Where these conditions hold, intuition can be valuable; where they do not, it is unreliable. The same reasoning applies to data. Data-driven models work best where the environment is stable and the data are relevant and accurate.
Figure 2 suggests how to decide the balance.
Kahneman (2011) recommends a disciplined combination: break a judgement into separate dimensions, assess each using the best available evidence, and only then form an overall view. Kahneman, Sibony and Sunstein (2021) call this "decision hygiene": structuring judgement to reduce noise and bias without discarding human insight.
People's attitudes to data also matter. Dietvorst, Simmons and Massey (2015) found that people lose confidence in an algorithm after seeing it make a mistake, even when it outperforms them, a pattern they called algorithm aversion. Organisations that want to benefit from data need to help people understand that every method, human or statistical, makes errors, and that the question is which errs less.
Practical principles
For organisations seeking to use data well, the evidence suggests several principles:
- Start with the decision. Identify the decision and what would change it before collecting or analysing data.
- Check data quality and relevance. Ask how the data were produced, what they leave out and whether conditions have changed.
- Test measures against outcomes. Confirm that the indicators being tracked actually predict the results that matter.
- Experiment where possible. Controlled tests give stronger evidence than observational patterns.
- Do not turn every measure into a target. Use indicators for learning and diagnosis, and be cautious about attaching rewards to them.
- Use simple models where they work. Simple, transparent rules often perform as well as complex ones and are easier to trust and check.
- Combine data with structured judgement. Use data to inform and discipline judgement, not to replace it.
- Build data literacy. Train decision-makers to interpret statistics, uncertainty and causal claims.
Questions to ask of any data-driven recommendation
Intelligence analysts are often asked to review recommendations that claim to be "based on the data". A short set of questions helps judge how much weight such a claim deserves:
- Where did the data come from? Were they collected for this purpose, or are they a by-product of another process, such as billing or web logs, with gaps and biases of their own?
- What period do they cover? Have conditions changed since then in ways that might alter the pattern?
- Who or what is missing? Customers who left, markets the firm does not serve, or events that were not recorded can all distort the picture.
- Is the finding causal or only a correlation? If causal, what evidence supports that? Was there an experiment or a natural comparison?
- How large is the effect, and how uncertain? A statistically significant result may be too small to matter; a large effect from a small sample may not hold up.
- Has the measure been tested against the outcome that matters? Or is it a convenient indicator assumed to be linked to results?
- What would change the recommendation? If no plausible evidence could change it, the data may be serving as decoration rather than as a basis for the decision.
Common mistakes
- Collecting data before defining the decision. Large data sets without a question rarely produce useful answers.
- Trusting dashboards uncritically. Numbers on a screen look authoritative, whatever the quality of the data behind them.
- Treating a target as the goal. When a measure becomes a target, people improve the measure, not necessarily the outcome.
- Ignoring base rates and uncertainty. A striking percentage change may rest on very small numbers.
- Discarding judgement entirely. Data describe the past; judgement is needed to decide whether the past is a good guide.
A business illustration
A chain of fitness clubs uses data from membership records to identify members at risk of leaving. A model trained on past cancellations finds that members who visit less than twice a month are most likely to leave. The marketing team proposes sending discounts to all such members. Before rolling out the campaign, the intelligence team runs a controlled test: half the at-risk members receive the discount and half do not. The discount makes little difference to cancellations, but it reduces revenue from members who would have stayed anyway. A second test, in which club staff phone at-risk members to offer a free session with a trainer, reduces cancellations noticeably at lower cost.
The data correctly identified who was at risk. They did not, on their own, show what would change their behaviour. The experiment did. The chain's managers now treat predictive models as a way to identify where to act, and experiments as the way to decide how.
Conclusion
The evidence for data-driven decision-making is real: firms that use data well tend to perform better, statistical rules often beat expert judgement in repeated decisions, and experiments reveal what actually works. But data can be wrong, measures can distort behaviour, correlations can mislead and patterns can break when conditions change. The most effective organisations neither defer blindly to data nor dismiss it. They ask what the data can and cannot show, test their measures and assumptions, and combine evidence with disciplined judgement.
References
Bevan, G., & Hood, C. (2006). What's measured is what matters: Targets and gaming in the English public health care system. Public Administration, 84(3), 517–538. https://doi.org/10.1111/j.1467-9299.2006.00600.x
Brynjolfsson, E., & McElheran, K. (2016). The rapid adoption of data-driven decision-making. American Economic Review, 106(5), 133–139. https://doi.org/10.1257/aer.p20161016
Brynjolfsson, E., Hitt, L. M., & Kim, H. H. (2011). Strength in numbers: How does data-driven decisionmaking affect firm performance? (Working paper). Social Science Research Network. https://doi.org/10.2139/ssrn.1819486
Campbell, D. T. (1979). Assessing the impact of planned social change. Evaluation and Program Planning, 2(1), 67–90. https://doi.org/10.1016/0149-7189(79)90048-X
Davenport, T. H., & Harris, J. G. (2007). Competing on analytics: The new science of winning. Harvard Business School Press.
Davenport, T. H. (2006). Competing on analytics. Harvard Business Review, 84(1), 98–107.
Dawes, R. M., Faust, D., & Meehl, P. E. (1989). Clinical versus actuarial judgment. Science, 243(4899), 1668–1674. https://doi.org/10.1126/science.2648573
Dietvorst, B. J., Simmons, J. P., & Massey, C. (2015). Algorithm aversion: People erroneously avoid algorithms after seeing them err. Journal of Experimental Psychology: General, 144(1), 114–126. https://doi.org/10.1037/xge0000033
Gigerenzer, G., Gaissmaier, W., Kurz-Milcke, E., Schwartz, L. M., & Woloshin, S. (2007). Helping doctors and patients make sense of health statistics. Psychological Science in the Public Interest, 8(2), 53–96. https://doi.org/10.1111/j.1539-6053.2008.00033.x
Grove, W. M., Zald, D. H., Lebow, B. S., Snitz, B. E., & Nelson, C. (2000). Clinical versus mechanical prediction: A meta-analysis. Psychological Assessment, 12(1), 19–30. https://doi.org/10.1037/1040-3590.12.1.19
Ittner, C. D., & Larcker, D. F. (2003). Coming up short on nonfinancial performance measurement. Harvard Business Review, 81(11), 88–95.
Kahneman, D., & Klein, G. (2009). Conditions for intuitive expertise: A failure to disagree. American Psychologist, 64(6), 515–526. https://doi.org/10.1037/a0016755
Kahneman, D. (2011). Thinking, fast and slow. Farrar, Straus and Giroux.
Kahneman, D., Sibony, O., & Sunstein, C. R. (2021). Noise: A flaw in human judgment. Little, Brown Spark.
Kerr, S. (1975). On the folly of rewarding A, while hoping for B. Academy of Management Journal, 18(4), 769–783. https://doi.org/10.5465/255378
Kohavi, R., Longbotham, R., Sommerfield, D., & Henne, R. M. (2009). Controlled experiments on the web: Survey and practical guide. Data Mining and Knowledge Discovery, 18(1), 140–181. https://doi.org/10.1007/s10618-008-0114-1
LaValle, S., Lesser, E., Shockley, R., Hopkins, M. S., & Kruschwitz, N. (2011). Big data, analytics and the path from insights to value. MIT Sloan Management Review, 52(2), 21–32.
Lazer, D., Kennedy, R., King, G., & Vespignani, A. (2014). The parable of Google Flu: Traps in big data analysis. Science, 343(6176), 1203–1205. https://doi.org/10.1126/science.1248506
McAfee, A., & Brynjolfsson, E. (2012). Big data: The management revolution. Harvard Business Review, 90(10), 60–68.
Meehl, P. E. (1954). Clinical versus statistical prediction: A theoretical analysis and a review of the evidence. University of Minnesota Press.
Muller, J. Z. (2018). The tyranny of metrics. Princeton University Press.
Pearl, J., & Mackenzie, D. (2018). The book of why: The new science of cause and effect. Basic Books.
Provost, F., & Fawcett, T. (2013). Data science and its relationship to big data and data-driven decision making. Big Data, 1(1), 51–59. https://doi.org/10.1089/big.2013.1508