
Insights · Tools and the future
Real-Time Insight From Continuous Data Collection
How continuous data streams, in-the-moment surveys and live dashboards can provide faster insight, what methods such as experience sampling and control charts offer, and the statistical and behavioural traps of watching data in real time.
Traditional consumer research looks backwards. A survey asks customers to recall what they did and felt weeks or months ago; a quarterly tracker reports what happened last quarter. Today, many organisations can observe customer behaviour continuously: transactions, website visits, app use, service contacts and feedback arrive as they happen. Short surveys can be sent to customers at the moment of an experience. This makes real-time insight possible. It also creates new risks, because data watched continuously contain a great deal of noise, and people watching them are prone to react to it. This article examines what real-time insight offers and how to use it well.
Capturing experience as it happens
Research in psychology has long recognised that people's recollections of experiences differ from how they felt at the time. Methods have been developed to capture experience closer to the moment. Csikszentmihalyi and Larson (1987) described the experience sampling method, in which participants are signalled at random times during the day and asked to report what they are doing and feeling, and reviewed evidence of its reliability and validity. Shiffman et al. (2008) reviewed "ecological momentary assessment", the repeated sampling of people's current behaviour and experiences in their natural environments, and argued that it reduces recall bias and captures how experiences vary over time and context. Bolger et al. (2003) reviewed the use of diary methods for capturing "life as it is lived". Kahneman et al. (2004) developed the day reconstruction method, a less burdensome alternative in which people reconstruct the previous day episode by episode.
These methods have been applied to customer experience. Macdonald et al. (2012) described "real-time experience tracking", in which customers send a short text message each time they encounter a brand, whether through advertising, a store visit or a conversation, reporting what happened and how they felt. Baxendale et al. (2015) used this method to study how different touchpoints affected brand consideration and found that touchpoints differed considerably in their effect on brand consideration, and that how positive the customer felt about each encounter mattered as well as how often encounters occurred.
Designing in-the-moment questions
Short surveys triggered by an event, such as a delivery, a call to a contact centre or a visit to a store, are now common. They capture reactions while they are fresh, but their design needs care.
Keep them very short. One to three questions, including one open question, are usually enough. Longer surveys reduce response and are more likely to be abandoned.
Time them to the experience. A question about a delivery is best asked shortly after it arrives, not at the moment of ordering or a week later. Asking too early captures expectations rather than experience; asking too late reintroduces recall bias.
Sample, do not survey everyone. Asking every customer after every interaction leads to fatigue and lower-quality answers. Sampling a share of interactions gives reliable estimates while protecting customers' goodwill.
Watch who responds. Customers who have had a very good or very bad experience are often more likely to respond than those whose experience was unremarkable. Comparing respondents with all customers on known characteristics, and weighting where necessary, reduces the resulting bias.
Link answers to behaviour. Connecting in-the-moment feedback to what customers later did, such as whether they bought again, shows which experiences matter most.
Continuous behavioural data
Much real-time insight now comes not from asking but from observing. Transaction systems, websites and apps record behaviour as it happens. Choi and Varian (2012) showed that search data could be used to "predict the present", improving estimates of current economic indicators such as retail sales before official statistics were published. Organisations can similarly track demand, engagement and problems as they emerge, rather than waiting for periodic reports.
Continuous data also allow continuous experimentation. Kohavi et al. (2020) described how large online businesses run thousands of controlled experiments each year, testing changes on a share of users and measuring their effects on behaviour in near real time. This combines the speed of continuous data with the causal clarity of experiments.
Separating signal from noise
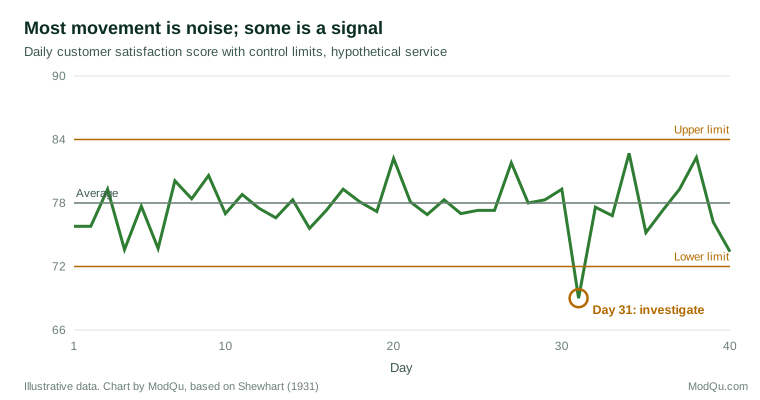
Data watched continuously fluctuate. Daily sales rise and fall with the weather, the day of the week, promotions and chance. The central challenge of real-time insight is distinguishing changes that matter from normal variation.
Methods from quality control address exactly this problem. Shewhart (1931) developed control charts, which plot a measure over time with limits based on its normal variation, so that only points outside the limits, or unusual patterns within them, are treated as signals worth investigating. Page (1954) proposed cumulative sum methods that detect small, persistent shifts more quickly than simple limits. Montgomery (2019) describes these methods in detail. They are as useful for customer metrics as for manufacturing processes.
The danger of peeking
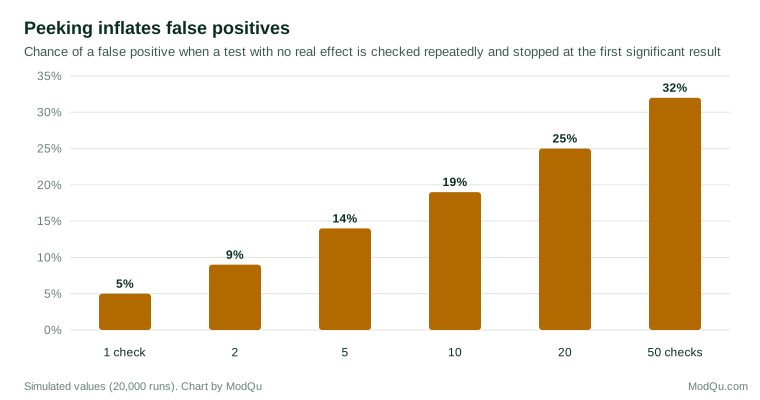
Watching results accumulate creates a specific statistical problem. If a test of a difference is repeated each time new data arrive, and the analyst stops as soon as the result looks significant, the chance of a false positive rises well above the nominal level. Armitage et al. (1969) showed this for clinical trials with accumulating data. Johari et al. (2017) showed that the same problem affected online experiments in which users watched results continuously and stopped tests early when they appeared significant, and proposed methods that allow results to be monitored continuously without inflating false positives.
Watching too closely
Continuous data also affect the people who watch them. Thaler et al. (1997) found in an experiment that investors who received frequent feedback on their returns took less risk and earned less than those who received feedback less often, because frequent feedback showed more short-term losses, which they weighed heavily. Managers watching daily metrics can be similarly drawn into reacting to every fluctuation, changing course before the effects of earlier changes are known.
Real-time data also compete for attention. Simon (1971) warned that a wealth of information creates a poverty of attention. Ancker et al. (2017) found that clinicians increasingly overrode automated alerts as the number of alerts increased. A real-time dashboard that flags every movement soon trains its users to ignore it.
Finally, relationships in continuous data change. Gama et al. (2014) described "concept drift", changes over time in the relationships that models rely on, and the need to monitor and update models used on streaming data.
Organising to act in real time
Real-time insight is valuable only if someone can act on it quickly. Organisations that use it well agree in advance who will be alerted for each type of signal, what they are authorised to do, and how quickly. A "playbook" for common problems, such as a sudden fall in conversion, a rise in complaints about a product or a spike in service contacts, sets out the first checks to make and the actions to take. Without such arrangements, alerts reach people who cannot act on them, or reach no one at all.
It also helps to separate two roles. Operational teams respond to signals that need immediate action, such as a broken checkout page. Insight teams look at patterns over weeks and months, asking why signals occur and whether underlying causes need to be addressed. Real-time data serve both, but in different ways.
An example
Consider a hypothetical online grocer that sends a two-question survey to a random 10% of customers within an hour of each delivery: a rating from 1 to 5 and an open question. Results feed a dashboard with control limits for each depot.
One morning, the rating for one depot falls below its lower limit for the second day running. The alert goes to the depot manager, whose playbook says to check the open comments first. Many mention bruised fruit and crushed bread. The manager finds that a new packing team has been loading heavy items on top. The problem is fixed the same day, and ratings return to normal within the week.
At the same time, the insight team reviews the month's data and notices a slower pattern: across all depots, ratings for deliveries in the last time slot of the day are slightly but consistently lower. No single day crosses a control limit, but the difference persists for eight weeks. Further analysis shows that late deliveries are more often missing substituted items. This becomes a project for the operations team rather than an alert.
The same data stream served two purposes: rapid correction of a local problem and slower discovery of a systematic one.
Using real-time insight well
- Match speed to the decision. Real-time data are valuable when a decision can be made quickly, such as fixing a broken checkout or responding to a service failure. For strategic decisions, longer periods give more reliable evidence.
- Use control limits, not raw movements. Base alerts on statistically defined limits and persistent patterns.
- Decide in advance how long tests will run, or use methods designed for continuous monitoring.
- Combine fast and slow data. Use continuous behavioural data to detect changes quickly, and periodic research to understand why.
- Limit alerts. Alert only on the few measures that require rapid action, and review how often alerts lead to action.
- Capture experiences in the moment where recall would distort them, using short, well-timed questions.
Key takeaways
Continuous data collection allows organisations to observe customer behaviour and experiences as they happen, reducing recall bias and speeding detection of problems. Methods such as experience sampling and real-time experience tracking capture feelings in the moment, and continuous experimentation combines speed with causal evidence. But continuous data are noisy, repeated checking inflates false positives, frequent feedback encourages overreaction, and too many alerts are ignored. Control charts, pre-specified test durations, limited alerts and a combination of fast and slow data make real-time insight useful rather than distracting.
References
Ancker, J. S., Edwards, A., Nosal, S., Hauser, D., Mauer, E., & Kaushal, R. (2017). Effects of workload, work complexity, and repeated alerts on alert fatigue in a clinical decision support system. BMC Medical Informatics and Decision Making, 17, Article 36. https://doi.org/10.1186/s12911-017-0430-8
Armitage, P., McPherson, C. K., & Rowe, B. C. (1969). Repeated significance tests on accumulating data. Journal of the Royal Statistical Society: Series A (General), 132(2), 235–244. https://doi.org/10.2307/2343787
Baxendale, S., Macdonald, E. K., & Wilson, H. N. (2015). The impact of different touchpoints on brand consideration. Journal of Retailing, 91(2), 235–253. https://doi.org/10.1016/j.jretai.2014.12.008
Bolger, N., Davis, A., & Rafaeli, E. (2003). Diary methods: Capturing life as it is lived. Annual Review of Psychology, 54, 579–616. https://doi.org/10.1146/annurev.psych.54.101601.145030
Choi, H., & Varian, H. (2012). Predicting the present with Google Trends. Economic Record, 88(S1), 2–9. https://doi.org/10.1111/j.1475-4932.2012.00809.x
Csikszentmihalyi, M., & Larson, R. (1987). Validity and reliability of the experience-sampling method. The Journal of Nervous and Mental Disease, 175(9), 526–536. https://doi.org/10.1097/00005053-198709000-00004
Gama, J., Žliobaitė, I., Bifet, A., Pechenizkiy, M., & Bouchachia, A. (2014). A survey on concept drift adaptation. ACM Computing Surveys, 46(4), Article 44. https://doi.org/10.1145/2523813
Johari, R., Koomen, P., Pekelis, L., & Walsh, D. (2017). Peeking at A/B tests: Why it matters, and what to do about it. In Proceedings of the 23rd ACM SIGKDD International Conference on Knowledge Discovery and Data Mining (pp. 1517–1525). ACM. https://doi.org/10.1145/3097983.3097992
Kahneman, D., Krueger, A. B., Schkade, D. A., Schwarz, N., & Stone, A. A. (2004). A survey method for characterizing daily life experience: The day reconstruction method. Science, 306(5702), 1776–1780. https://doi.org/10.1126/science.1103572
Kohavi, R., Tang, D., & Xu, Y. (2020). Trustworthy online controlled experiments: A practical guide to A/B testing. Cambridge University Press. https://doi.org/10.1017/9781108653985
Macdonald, E. K., Wilson, H. N., & Konuş, U. (2012). Better customer insight—in real time. Harvard Business Review, 90(9), 102–108.
Montgomery, D. C. (2019). Introduction to statistical quality control (8th ed.). Wiley.
Page, E. S. (1954). Continuous inspection schemes. Biometrika, 41(1–2), 100–115. https://doi.org/10.1093/biomet/41.1-2.100
Shewhart, W. A. (1931). Economic control of quality of manufactured product. Van Nostrand.
Shiffman, S., Stone, A. A., & Hufford, M. R. (2008). Ecological momentary assessment. Annual Review of Clinical Psychology, 4, 1–32. https://doi.org/10.1146/annurev.clinpsy.3.022806.091415
Simon, H. A. (1971). Designing organizations for an information-rich world. In M. Greenberger (Ed.), Computers, communications, and the public interest (pp. 37–72). Johns Hopkins Press.
Thaler, R. H., Tversky, A., Kahneman, D., & Schwartz, A. (1997). The effect of myopia and loss aversion on risk taking: An experimental test. The Quarterly Journal of Economics, 112(2), 647–661. https://doi.org/10.1162/003355397555226