
Insights · Tools and the future
Automated Insight: Can Software Find What Matters?
How automated insight tools search data for notable patterns, how they judge what is interesting, why they generate false discoveries and miss context, how people respond to automated findings, and how to combine automation with human judgement.
Many analytics platforms now promise to find insights automatically. Connect the data, and the software scans every combination of measures and dimensions, flags unusual changes, identifies the drivers of a metric and writes a short summary in plain language. The appeal is clear. Analysts are scarce, data are plentiful, and no human can examine every slice of a large dataset. But finding a pattern is not the same as finding what matters. This article examines how automated insight tools work, what they do well, where they fall short and how organisations can use them without being misled.
How automated insight works
Most automated insight tools follow a similar process. They enumerate many subsets of the data, such as each region, product, channel and period, and compute candidate patterns within each: trends, outliers, shifts in share, correlations, differences from a forecast. They then score each candidate for how "interesting" it is and present the highest-scoring ones, often with a chart and a sentence of explanation.
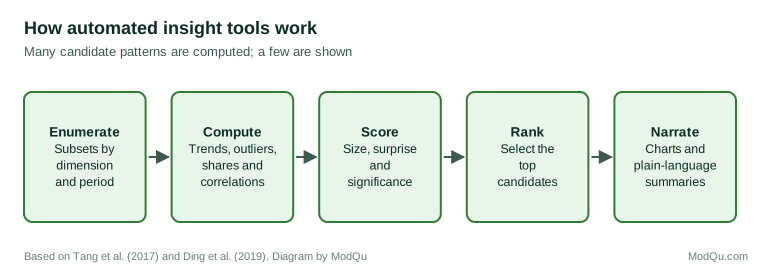
Researchers have developed and tested such systems. Tang et al. (2017) described a method for extracting the "top-k" insights from multi-dimensional data, by computing many types of pattern across subspaces of the data and ranking them by a measure of significance and impact. Ding et al. (2019) described a system that automatically discovered and ranked insights from business data and reported that it found patterns users considered useful. Vartak et al. (2015) developed a system that recommended visualisations by searching for those that showed the largest differences between a subset of data and a reference, and Wongsuphasawat et al. (2016) developed a tool that recommended charts to support exploration of unfamiliar datasets.
The idea has deep roots. Fayyad et al. (1996) described knowledge discovery in databases as a process of selecting, preprocessing, transforming, mining and interpreting data, and stressed that the final step, interpretation by people, determines whether the patterns found are useful. Agrawal et al. (1993) introduced methods for mining association rules, such as which products are bought together, from large transaction databases, an early example of software finding patterns no one had asked about.
What makes a pattern interesting?
The central difficulty is deciding which patterns matter. Silberschatz and Tuzhilin (1996) distinguished objective measures of interestingness, based on statistical properties such as the size or rarity of a pattern, from subjective measures, based on whether the pattern is unexpected to the user and whether the user can act on it. Geng and Hamilton (2006) surveyed dozens of interestingness measures used in data mining and found that they often disagreed, and that none captured what users found useful in all situations.
Software can measure size, rarity and statistical significance. It is much harder for software to judge whether a pattern is surprising given what the organisation already knows, whether it reflects a known event, or whether anything can be done about it. A tool may report that sales in one region fell 30% last week, without knowing that the region's largest store was closed for refurbishment. It may report that customers who use a feature spend more, without knowing that the feature is offered only to premium customers.
The multiple comparisons problem
Automated insight tools test a very large number of patterns, and this creates a serious statistical problem. If a tool examines thousands of subsets and flags those that look unusual at a conventional level of significance, many of the flagged patterns will be due to chance alone. Hand (1998) warned that data mining's search through very large numbers of patterns makes spurious findings inevitable unless the search is accounted for.
Zgraggen et al. (2018) studied people exploring data visually and found that a large share of the "insights" they reported would have been false discoveries had they been tested statistically, because the participants implicitly compared many views of the data. Binnig et al. (2017) argued that systems which automatically explore data must control the rate of false discoveries across all the patterns they examine, using methods such as that of Benjamini and Hochberg (1995), and proposed ways to do so as exploration proceeds.
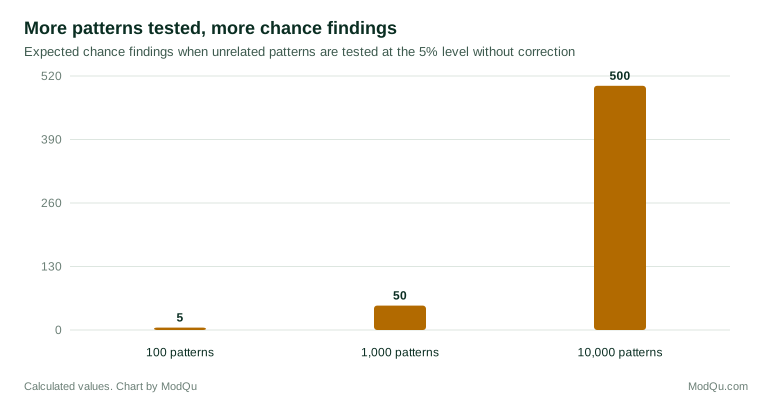
Many commercial tools do not explain how many patterns they examined or whether they corrected for the search. Their outputs should therefore be treated as candidates for investigation, not as findings.
Correlation, cause and context
Automated tools are mainly good at finding associations. Many present them in causal language: "the main driver of churn is X". But a variable that predicts an outcome is not necessarily a cause of it. Pearl and Mackenzie (2018) explained why data alone, without assumptions about how variables influence each other, cannot distinguish cause from correlation. A tool that ranks "key drivers" by their statistical association with an outcome may highlight variables that are consequences of the outcome, or that share a common cause with it.
Automated narratives add a further risk. Tools that use language models to write explanations may produce fluent statements that go beyond what the analysis shows. Ji et al. (2023) reviewed research on such "hallucinations" in generated text. An automated summary that says sales fell "because of" a competitor's promotion may be offering a guess dressed as a finding.
How people respond to automated findings
Research on automation shows that people can both over-rely on and under-rely on automated systems. Parasuraman and Riley (1997) distinguished "misuse", over-reliance on automation, from "disuse", neglect of automation that would have helped. Skitka et al. (1999) found that people using an automated decision aid made errors of omission, missing problems the aid failed to flag, and errors of commission, following the aid's incorrect recommendations, that people working without the aid did not make. This "automation bias" means that an automated insight tool can narrow attention to what it reports and away from what it misses.
People's trust in algorithms is not fixed. Dietvorst et al. (2015) found that people who saw an algorithm make mistakes became much less willing to use it, even when it outperformed human forecasters. A tool that produces many trivial or false insights may quickly be ignored, including when it finds something important.
Bainbridge (1983) described the "ironies of automation": as systems take over routine work, the people who supervise them have fewer chances to develop the skills needed to recognise when the system has gone wrong. If analysts stop exploring data themselves, they may lose the understanding needed to judge what automated tools report.
What automated insight does well
Despite these limits, automated insight has real strengths.
Coverage. Software can examine far more slices of data than people can, and can do so continuously. It is well suited to monitoring many metrics for unusual changes.
Speed. Routine questions, such as which regions or products drove a change in a total, can be answered in seconds.
Anomaly detection. Chandola et al. (2009) reviewed a wide range of methods for detecting anomalies in data, many of which are now built into monitoring tools. Flagging an unexpected change quickly can prompt investigation before a problem grows.
Starting points. For an unfamiliar dataset, automated recommendations can suggest where to look first.
Democratisation. People without analytical training can explore data and receive explanations in plain language, which can broaden the use of data in an organisation, provided they understand the limits of what they are shown.
Consistency. Software applies the same checks every day, to every metric, without fatigue or favourites. Human analysts naturally look most closely at the measures they care about or expect to change, and can miss problems elsewhere. An automated tool that monitors every product line and region with the same rules can catch issues in parts of the business that no analyst was watching.
Freeing analyst time. By handling routine monitoring and simple decompositions, automated tools can free analysts to spend more time on the questions that need judgement: explaining why something happened, designing experiments and working with decision makers. Whether this happens in practice depends on how the organisation uses the time saved.
Conversational analytics
A newer generation of tools lets users ask questions of data in ordinary language, such as "why did sales fall in March?", and receive an answer, a chart and an explanation. These tools translate the question into a query, run it and describe the result. They lower the barrier to using data, but they add new points of failure. The question may be translated into a query that answers a slightly different question, for example by using the wrong definition of a sale or the wrong date range. The explanation may present a correlation as the reason. And because the answer arrives as fluent prose, users may not notice either problem.
People often trust such outputs readily. Logg et al. (2019) found that people frequently gave more weight to advice when they believed it came from an algorithm than from a person, especially when they had no particular expertise in the task. Combined with the confident tone of generated text, this can lead users to accept answers they would question if a colleague gave them. Good conversational tools show the query they ran, the definitions they used and the data behind each statement, so that users can check them.
Evaluating an automated insight tool
Before relying on an automated insight tool, organisations can assess it in several ways.
Test it on the past. Run the tool on historical data covering periods when the organisation knows what happened: a pricing error, a successful campaign, a supply problem. Did it find the known events? How many other findings did it report alongside them, and how many of those were real?
Ask how it decides what to show. Find out how many patterns the tool examines, how it scores them and whether it adjusts for the number of comparisons. A tool that cannot answer these questions cannot tell users how much to trust its findings.
Check its language. Look at how findings are phrased. Tools that describe associations as "drivers" or "causes" without causal evidence will mislead users who take the words at face value.
Check whether it learns context. Can users mark findings as known, irrelevant or wrong, and does the tool use this to improve? Without such feedback, the same trivial alerts will recur.
Check the audit trail. Can each finding be traced to the data and calculation behind it? This matters both for checking results and for explaining them to others.
Watch real users. Observe how people in the organisation use the tool and what they do with its findings. The value of a tool depends less on what it can find than on whether its findings lead to good decisions.
Combining automation with judgement
Keim et al. (2008) described "visual analytics" as the combination of automated analysis with interactive visualisation, so that human judgement and machine computation each do what they do best. Shneiderman (2020) argued that the goal should be systems that give people high levels of both automation and control, rather than a trade-off between them. For automated insight, this suggests a division of labour.
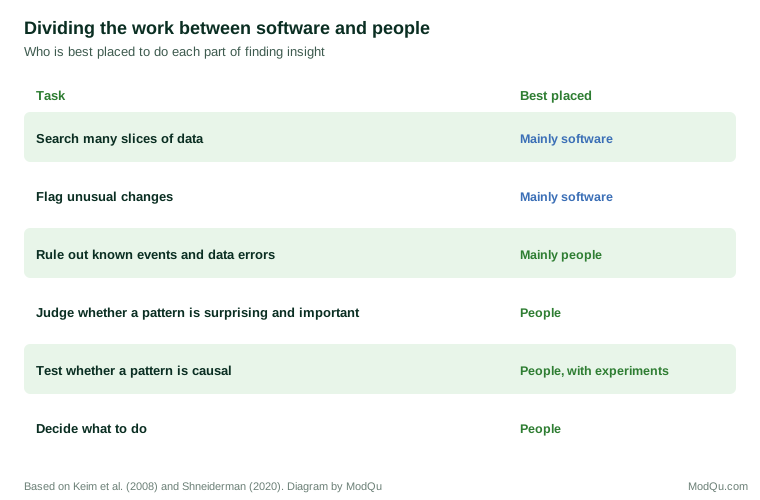
Practical steps include:
- Ask how many patterns were tested and whether the tool controls for false discoveries. Prefer tools that report this.
- Treat outputs as leads. Each automated finding should be checked for data errors, known events and plausibility before it is reported.
- Confirm on new data. A pattern found in one period should be checked in another before action is taken.
- Separate association from cause. Replace "driver" language with "associated with" unless causal evidence exists, and test promising relationships with experiments.
- Feed context back. Where tools allow it, record known events, such as promotions, closures and system changes, so that they can be excluded from future alerts.
- Tune the volume. Set thresholds so that the tool reports few enough findings that each receives attention.
- Keep analysts exploring. Make sure people continue to work directly with the data, so that they retain the understanding needed to judge automated results.
An example
Consider a hypothetical subscription business that introduces an automated insight tool. In its first week, the tool reports 140 insights, including "Cancellations among customers in the north-east rose 45% on Tuesday" and "Customers who contacted support are three times more likely to cancel".
The insight team investigates. The north-east rise involved 11 cancellations instead of the usual 7–8, a change well within normal variation given the small numbers. The support finding is real but not causal in the sense implied: customers contact support because they have problems, and problems lead to cancellations. Reducing support contacts would not reduce cancellations.
Among the 140 reports, however, is one the team had not noticed: cancellations among customers on annual plans have risen steadily for three months, across all regions. Checking the data confirms the trend, and further analysis links it to a price change for annual renewals. The tool found something important, but only alongside many reports that were noise or misleading. The team adjusts the tool's thresholds, adds known events to its calendar and introduces a weekly review in which an analyst checks the top findings before they are shared.
Key takeaways
Automated insight tools search many slices of data for notable patterns, score them and present the highest-ranked with charts and summaries. They offer coverage, speed and useful anomaly detection. But software can judge size and rarity better than importance, and searching many patterns guarantees false discoveries unless the search is controlled. Tools often present associations in causal language and may generate explanations that go beyond the evidence. People tend to over-rely on automation and then abandon it when it errs. Automated insight works best as a source of leads for human investigation, with checks for chance, data errors, known events and causality before findings are acted on.
References
Agrawal, R., Imieliński, T., & Swami, A. (1993). Mining association rules between sets of items in large databases. In Proceedings of the 1993 ACM SIGMOD International Conference on Management of Data (pp. 207–216). ACM. https://doi.org/10.1145/170035.170072
Bainbridge, L. (1983). Ironies of automation. Automatica, 19(6), 775–779. https://doi.org/10.1016/0005-1098(83)90046-8
Benjamini, Y., & Hochberg, Y. (1995). Controlling the false discovery rate: A practical and powerful approach to multiple testing. Journal of the Royal Statistical Society: Series B (Methodological), 57(1), 289–300. https://doi.org/10.1111/j.2517-6161.1995.tb02031.x
Binnig, C., De Stefani, L., Kraska, T., Upfal, E., Zgraggen, E., & Zhao, Z. (2017). Toward sustainable insights, or why polygamy is bad for you. In Proceedings of the 8th Biennial Conference on Innovative Data Systems Research. CIDR.
Chandola, V., Banerjee, A., & Kumar, V. (2009). Anomaly detection: A survey. ACM Computing Surveys, 41(3), Article 15. https://doi.org/10.1145/1541880.1541882
Dietvorst, B. J., Simmons, J. P., & Massey, C. (2015). Algorithm aversion: People erroneously avoid algorithms after seeing them err. Journal of Experimental Psychology: General, 144(1), 114–126. https://doi.org/10.1037/xge0000033
Ding, R., Han, S., Xu, Y., Zhang, H., & Zhang, D. (2019). QuickInsights: Quick and automatic discovery of insights from multi-dimensional data. In Proceedings of the 2019 International Conference on Management of Data (pp. 317–332). ACM. https://doi.org/10.1145/3299869.3314037
Fayyad, U., Piatetsky-Shapiro, G., & Smyth, P. (1996). From data mining to knowledge discovery in databases. AI Magazine, 17(3), 37–54. https://doi.org/10.1609/aimag.v17i3.1230
Geng, L., & Hamilton, H. J. (2006). Interestingness measures for data mining: A survey. ACM Computing Surveys, 38(3), Article 9. https://doi.org/10.1145/1132960.1132963
Hand, D. J. (1998). Data mining: Statistics and more? The American Statistician, 52(2), 112–118. https://doi.org/10.1080/00031305.1998.10480549
Ji, Z., Lee, N., Frieske, R., Yu, T., Su, D., Xu, Y., Ishii, E., Bang, Y. J., Madotto, A., & Fung, P. (2023). Survey of hallucination in natural language generation. ACM Computing Surveys, 55(12), Article 248. https://doi.org/10.1145/3571730
Keim, D., Andrienko, G., Fekete, J.-D., Görg, C., Kohlhammer, J., & Melançon, G. (2008). Visual analytics: Definition, process, and challenges. In A. Kerren, J. T. Stasko, J.-D. Fekete, & C. North (Eds.), Information visualization: Human-centered issues and perspectives (pp. 154–175). Springer. https://doi.org/10.1007/978-3-540-70956-5_7
Logg, J. M., Minson, J. A., & Moore, D. A. (2019). Algorithm appreciation: People prefer algorithmic to human judgment. Organizational Behavior and Human Decision Processes, 151, 90–103. https://doi.org/10.1016/j.obhdp.2018.12.005
Parasuraman, R., & Riley, V. (1997). Humans and automation: Use, misuse, disuse, abuse. Human Factors, 39(2), 230–253. https://doi.org/10.1518/001872097778543886
Pearl, J., & Mackenzie, D. (2018). The book of why: The new science of cause and effect. Basic Books.
Shneiderman, B. (2020). Human-centered artificial intelligence: Reliable, safe & trustworthy. International Journal of Human–Computer Interaction, 36(6), 495–504. https://doi.org/10.1080/10447318.2020.1741118
Silberschatz, A., & Tuzhilin, A. (1996). What makes patterns interesting in knowledge discovery systems. IEEE Transactions on Knowledge and Data Engineering, 8(6), 970–974. https://doi.org/10.1109/69.553165
Skitka, L. J., Mosier, K. L., & Burdick, M. (1999). Does automation bias decision-making? International Journal of Human-Computer Studies, 51(5), 991–1006. https://doi.org/10.1006/ijhc.1999.0252
Tang, B., Han, S., Yiu, M. L., Ding, R., & Zhang, D. (2017). Extracting top-k insights from multi-dimensional data. In Proceedings of the 2017 ACM International Conference on Management of Data (pp. 1509–1524). ACM. https://doi.org/10.1145/3035918.3035922
Vartak, M., Rahman, S., Madden, S., Parameswaran, A., & Polyzotis, N. (2015). SeeDB: Efficient data-driven visualization recommendations to support visual analytics. Proceedings of the VLDB Endowment, 8(13), 2182–2193. https://doi.org/10.14778/2831360.2831371
Wongsuphasawat, K., Moritz, D., Anand, A., Mackinlay, J., Howe, B., & Heer, J. (2016). Voyager: Exploratory analysis via faceted browsing of visualization recommendations. IEEE Transactions on Visualization and Computer Graphics, 22(1), 649–658. https://doi.org/10.1109/TVCG.2015.2467191
Zgraggen, E., Zhao, Z., Zeleznik, R., & Kraska, T. (2018). Investigating the effect of the multiple comparisons problem in visual analysis. In Proceedings of the 2018 CHI Conference on Human Factors in Computing Systems (Paper 479). ACM. https://doi.org/10.1145/3173574.3174053