
Insights · Tools and the future
Pattern Recognition Algorithms versus Human Pattern Perception in Insight Formation
How algorithms and people differ in finding patterns in data, where each is stronger, the characteristic errors of each, and how to combine them so that insight benefits from both.
Insight begins with noticing a pattern. Both people and algorithms can do this, but they do it in different ways, and they fail in different ways. Algorithms can search vast datasets without tiring and detect subtle regularities that people would never see. People can recognise what a pattern means, notice when it does not make sense and connect it to knowledge outside the data. Understanding the strengths and weaknesses of each helps organisations decide how to combine them.
How people see patterns
Human pattern perception is fast and powerful. The visual system groups and separates elements, detects outliers and picks out trends almost instantly. Healey and Enns (2012) reviewed how attention and visual memory shape what people notice in visual displays. Expertise adds to this. Chase and Simon (1973) found that chess masters recognised meaningful configurations of pieces at a glance, a skill built through long experience.
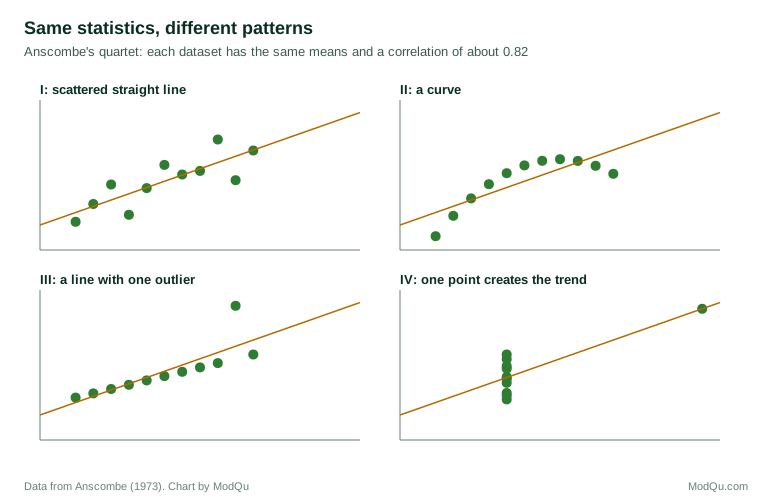
Seeing data can reveal what summary statistics hide. Anscombe (1973) constructed four small datasets with the same means, variances and correlation, which look completely different when plotted: one a simple linear relationship, one a curve, one a straight line with a single outlier, and one determined almost entirely by a single point. Matejka and Fitzmaurice (2017) extended the idea, generating many datasets with identical summary statistics but very different shapes.
But people also see patterns that are not there. Gilovich et al. (1985) found that basketball players and fans believed in "hot hands", streaks of successful shots, much more strongly than the shooting data in their study supported. People expect random sequences to alternate more than they do, and so read meaning into ordinary runs. Kahneman and Klein (2009) concluded that intuitive pattern recognition is reliable only where the environment is regular and people have had extensive practice with feedback.
How algorithms find patterns
Machine learning algorithms find patterns by fitting models to data. Deep learning systems, which learn layered representations from large amounts of data, have achieved remarkable performance in recognising images, speech and text (LeCun et al., 2015). Algorithms can examine thousands of variables at once and detect interactions that no person could hold in mind.
They also have characteristic failures. Geirhos et al. (2020) described "shortcut learning", in which models achieve high accuracy by relying on features that happen to predict the outcome in the training data but are not the features that matter, such as recognising cows by the green fields they usually stand in. Such models perform well until the shortcut stops working. Lake et al. (2017) argued that, unlike people, current machine learning systems typically need far more examples to learn, and lack the causal models and background knowledge people use to generalise from a few cases and to judge whether a pattern makes sense.
An example
Consider a hypothetical retailer that trains a model to predict which online shoppers will make a purchase. The model is highly accurate in testing. When analysts examine which features drive its predictions, they find that the strongest is whether the shopper visited the delivery information page. On reflection, this is a shortcut: shoppers check delivery details when they have already decided to buy. The feature predicts purchase but offers no lever for increasing it, and it would mislead anyone who concluded that promoting the delivery page would raise sales.
At the same time, a merchandiser reviewing the data visually spots something the model did not flag: a cluster of shoppers who repeatedly add an item to the basket, remove it and return days later. Interviews reveal that they are waiting for a price drop. The algorithm found a strong but uninformative pattern; the person found a weak but meaningful one. Neither alone would have produced the insight.
Combining the two
The strengths of people and algorithms are largely complementary.
- Algorithms search; people interpret. Let algorithms scan large data for candidate patterns, and let people judge which are meaningful.
- Plot what algorithms find. As Anscombe showed, a picture can reveal what a summary hides, including outliers that drive a result.
- Ask what the algorithm relies on. Examine which features drive a model's predictions, and whether they are plausible causes or shortcuts.
- Check human hunches with data. Patterns people believe they see should be tested statistically, especially when they confirm expectations.
- Validate both on new data. Neither human nor machine patterns should be trusted until they hold on data not used to find them.
Key takeaways
People see patterns quickly and can judge their meaning, but also see patterns in randomness. Algorithms search far more data and find subtle regularities, but can rely on shortcuts and lack the knowledge to judge whether a pattern makes sense. Insight is strongest when algorithms search, people interpret, both are checked against new data, and patterns are visualised before they are believed.
References
Anscombe, F. J. (1973). Graphs in statistical analysis. The American Statistician, 27(1), 17–21. https://doi.org/10.1080/00031305.1973.10478966
Chase, W. G., & Simon, H. A. (1973). Perception in chess. Cognitive Psychology, 4(1), 55–81. https://doi.org/10.1016/0010-0285(73)90004-2
Geirhos, R., Jacobsen, J.-H., Michaelis, C., Zemel, R., Brendel, W., Bethge, M., & Wichmann, F. A. (2020). Shortcut learning in deep neural networks. Nature Machine Intelligence, 2(11), 665–673. https://doi.org/10.1038/s42256-020-00257-z
Gilovich, T., Vallone, R., & Tversky, A. (1985). The hot hand in basketball: On the misperception of random sequences. Cognitive Psychology, 17(3), 295–314. https://doi.org/10.1016/0010-0285(85)90010-6
Healey, C. G., & Enns, J. T. (2012). Attention and visual memory in visualization and computer graphics. IEEE Transactions on Visualization and Computer Graphics, 18(7), 1170–1188. https://doi.org/10.1109/TVCG.2011.127
Kahneman, D., & Klein, G. (2009). Conditions for intuitive expertise: A failure to disagree. American Psychologist, 64(6), 515–526. https://doi.org/10.1037/a0016755
Lake, B. M., Ullman, T. D., Tenenbaum, J. B., & Gershman, S. J. (2017). Building machines that learn and think like people. Behavioral and Brain Sciences, 40, Article e253. https://doi.org/10.1017/S0140525X16001837
LeCun, Y., Bengio, Y., & Hinton, G. (2015). Deep learning. Nature, 521(7553), 436–444. https://doi.org/10.1038/nature14539
Matejka, J., & Fitzmaurice, G. (2017). Same stats, different graphs: Generating datasets with varied appearance and identical statistics through simulated annealing. In Proceedings of the 2017 CHI Conference on Human Factors in Computing Systems (pp. 1290–1294). ACM. https://doi.org/10.1145/3025453.3025912