
Insights · Insight quality and pitfalls
Insight Fatigue and Information Overload in High-Volume Analytical Settings
Why a constant flow of dashboards, alerts and reports can reduce rather than improve decision making, the evidence on information overload and alert fatigue, and how insight teams can deliver fewer, better findings.
Many organisations now produce more analysis than anyone can use. Dashboards refresh daily, automated tools flag every unusual movement, and each team circulates its own reports. The intention is to keep decision makers informed. The effect is often the opposite: people stop reading, alerts are ignored and important findings are lost among trivial ones. This is insight fatigue, a form of information overload in which the volume of findings reduces attention to each of them.
Too much information
The problem was identified long before modern analytics. Simon (1971) observed that a wealth of information creates a poverty of attention, so that the scarce resource in an information-rich organisation is the attention of the people who must use it. Ackoff (1967) argued that managers suffer less from a lack of relevant information than from an excess of irrelevant information, and that management information systems should filter and condense rather than add.
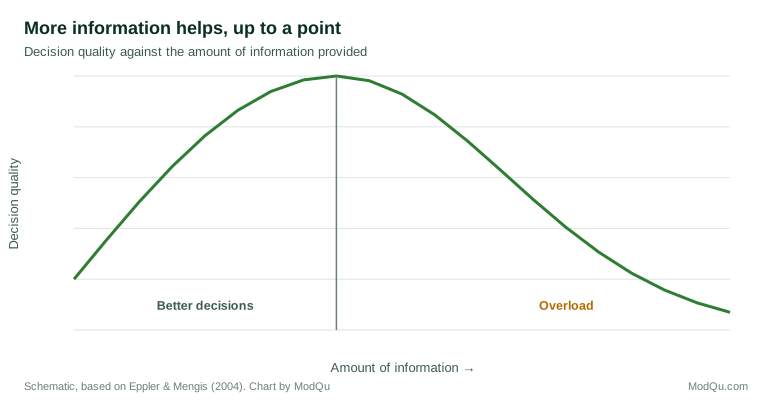
Eppler and Mengis (2004) reviewed research on information overload across several disciplines. They described a common finding that decision quality rises with the amount of information up to a point and then falls, as people become confused, ignore relevant information and take longer to decide. In a consumer study, Jacoby et al. (1974) found that giving shoppers more information about more brands eventually led to poorer choices, even though participants felt more satisfied with more information.
Alert fatigue
Automated alerts show the same pattern. Ancker et al. (2017) studied a hospital's clinical decision support system and found that clinicians were more likely to override alerts as the number of alerts they received increased, and as the same alert was repeated. When most alerts are unimportant, people learn to dismiss all of them, including the ones that matter. Anomaly detection in business dashboards carries the same risk: a system that flags every fluctuation teaches users to ignore it.
Why analytics teams overproduce
Several forces push towards more output. Self-service tools make new dashboards cheap to create but nobody is responsible for retiring old ones. Teams are often judged by what they deliver, so a report feels safer than a decision not to report. Automated monitoring can test thousands of metrics, and with that many tests some will move unusually by chance every day. And when a decision goes wrong, the instinct is to add a metric that would have caught it, while no metric is removed. Over time the volume grows and the share of output that matters falls.
An example
Consider a hypothetical online retailer whose analytics team sends a daily email listing every metric that moved more than two standard deviations. Most days the list has 30 to 40 items. Within months, managers stop opening it. When conversion on mobile devices falls sharply after a site update, the alert is sent on the first day but noticed only a week later, after customer complaints. The team then cuts the email to the five metrics tied to revenue and adds a rule that a metric must stay outside its normal range for two days before it is flagged. The list becomes short enough to read, and managers start acting on it again.
Signs of insight fatigue
Common signs include reports that are distributed but rarely opened, dashboards with many charts that nobody can explain, findings that are repeated across teams with different numbers, and decisions made without reference to available analysis.
Reducing fatigue
- Lead with the decision. Start each piece of analysis with the decision it informs and the action it recommends.
- Report less. Remove metrics and reports that have not influenced a decision in months.
- Set thresholds for alerts. Flag only changes that are large enough, and lasting enough, to matter, and review how many alerts are acted on.
- Have one source for each number. Agree a single definition and owner for key measures.
- Separate monitoring from insight. Routine figures belong in a dashboard; genuine findings deserve a short, explained message.
Key takeaways
More analysis does not automatically mean better decisions. Beyond a certain point, extra information lowers decision quality, and frequent alerts are increasingly ignored. Insight teams serve decision makers best by filtering, prioritising and explaining, so that the few findings that matter receive the attention they need.
References
Ackoff, R. L. (1967). Management misinformation systems. Management Science, 14(4), B147–B156. https://doi.org/10.1287/mnsc.14.4.B147
Ancker, J. S., Edwards, A., Nosal, S., Hauser, D., Mauer, E., & Kaushal, R. (2017). Effects of workload, work complexity, and repeated alerts on alert fatigue in a clinical decision support system. BMC Medical Informatics and Decision Making, 17, Article 36. https://doi.org/10.1186/s12911-017-0430-8
Eppler, M. J., & Mengis, J. (2004). The concept of information overload: A review of literature from organization science, accounting, marketing, MIS, and related disciplines. The Information Society, 20(5), 325–344. https://doi.org/10.1080/01972240490507974
Jacoby, J., Speller, D. E., & Kohn, C. A. (1974). Brand choice behavior as a function of information load. Journal of Marketing Research, 11(1), 63–69. https://doi.org/10.1177/002224377401100106
Simon, H. A. (1971). Designing organizations for an information-rich world. In M. Greenberger (Ed.), Computers, communications, and the public interest (pp. 37–72). Johns Hopkins Press.