
Insights · Generating insight
Identifying Contradictions Across Datasets and Stakeholder Accounts
Why sources of evidence often disagree, how to detect and diagnose contradictions between datasets and between the accounts of different stakeholders, and how to treat contradiction as a source of insight rather than a nuisance to be smoothed over.
Sooner or later, every analyst meets a contradiction. The customer survey says satisfaction is rising, but complaints are rising too. The sales team says customers are leaving because of price, while the exit interviews say it is service. The finance system and the marketing dashboard report different numbers of active customers. Senior managers describe a successful product launch that frontline staff remember as a disaster.
The temptation is to resolve such contradictions quickly: pick the source that seems more trustworthy, average the numbers, or report only the one that fits the story. That is usually a mistake. Contradictions are often where the most important insight lies, because they show that something is not as simple as it seems. This article explains why sources disagree, how to detect and diagnose contradictions systematically, and how to use them to build a better understanding.
Why contradictions are valuable
Research methodologists have long recognised the value of comparing different sources. Campbell and Fiske (1959) argued that a measure is valid only if it agrees with other measures of the same thing and disagrees with measures of different things, and that comparing several methods is the way to find out. Webb et al. (1966) argued for using multiple, independent measures, because each has its own weaknesses and a finding that survives several different measures is far more credible than one that depends on a single source. Denzin (1978) described this strategy as triangulation, distinguishing between triangulation of data sources, investigators, theories and methods.
Triangulation is often presented as a way of confirming findings. But its proponents recognised that disagreement is just as informative. Jick (1979) described how, when different methods produce divergent results, the search for an explanation can lead to richer understanding and new insights. Greene et al. (1989) identified "initiation", the discovery of paradox and contradiction, as one of the purposes of combining methods. Erzberger and Prein (1997) argued that results from different methods can converge, complement each other or diverge, and that divergence should prompt the development of new hypotheses rather than a choice between sources. Fetters et al. (2013) likewise described discordance between qualitative and quantitative findings as an outcome to be explained, for example by re-examining the data or collecting more.
The principle is simple. When two sources agree, we learn that a finding is probably robust. When they disagree, we learn that at least one of our assumptions about the sources, or about the world, is wrong. Finding out which is often more valuable than the original question.
Contradictions between datasets
Disagreements between datasets usually have one of a small number of explanations. Diagnosing which applies is the first step.
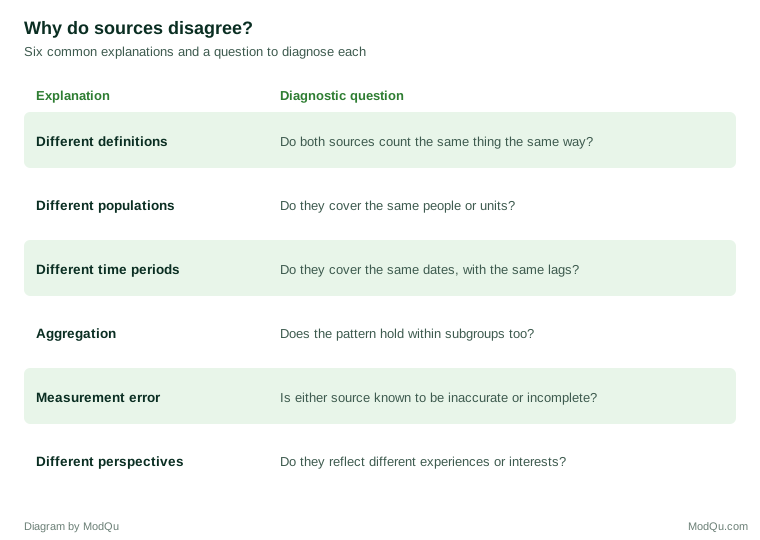
Different definitions. Two systems may count different things under the same name. An "active customer" may mean someone who bought in the past year in one system and someone with an open account in another. Wang and Strong (1996) found that data consumers judge quality on many dimensions beyond accuracy, including interpretability and consistency of representation, and inconsistent definitions are among the most common sources of conflicting numbers. Redman (1998) described how poor data quality, including inconsistencies between systems, imposes substantial costs on organisations and undermines trust in data.
Different populations. A satisfaction survey may reach only customers who responded to an email, while complaint data covers everyone who contacted the company. If satisfied customers are more likely to answer surveys, survey satisfaction can rise even as complaints increase.
Different time periods. Sources may cover different dates or record events with different lags. A sales system that records orders and a finance system that records payments will disagree for any period in which payments lag orders.
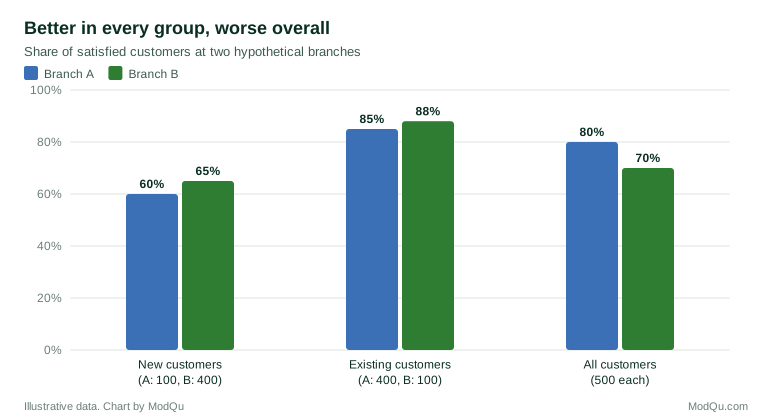
Aggregation. Relationships that hold overall can reverse within subgroups, and vice versa. This is Simpson's paradox, described by Simpson (1951). Bickel et al. (1975) gave a famous example: graduate admissions at the University of California, Berkeley appeared to favour men overall, but within most individual departments there was no such bias, or a small bias favouring women. The overall difference arose because women applied disproportionately to departments that admitted fewer applicants of either sex.
Measurement error. One source may simply be wrong: a tracking tag that stopped firing, a survey question that changed wording, a sensor that drifted.
Genuinely different perspectives. Sometimes both sources are accurate, and the contradiction reflects a real difference in the experiences they capture. This is particularly common with stakeholder accounts.
Contradictions between what people say and what they do
A frequent contradiction in insight work is between what people say and what they do. LaPiere (1934) travelled across the United States with a Chinese couple and found that they were refused service at only one of more than 250 establishments, yet when LaPiere later wrote to the same establishments asking whether they would accept Chinese guests, most of those that replied said they would not. Although the study has methodological limitations, it is a classic illustration of the gap between stated attitudes and behaviour.
Sheeran (2002) reviewed research on the relationship between intentions and behaviour and found that intentions predict behaviour only moderately: many people who intend to act do not. Nisbett and Wilson (1977) showed that people often cannot accurately report the reasons for their own behaviour, offering plausible explanations that do not reflect the real causes. Tourangeau and Yan (2007) reviewed how people misreport sensitive behaviours in surveys, typically under-reporting undesirable behaviours and over-reporting desirable ones.
When survey responses contradict behavioural data, therefore, the contradiction itself is informative. It may reveal social desirability, a gap between intention and action, or reasons that people do not recognise. Neither source should be discarded; the gap between them is a finding.
Contradictions between stakeholder accounts
Different stakeholders often give different accounts of the same events. Sales staff, product managers, customer service agents, finance teams and customers each see a different part of reality, and each has interests that shape what they notice and report.
Dearborn and Simon (1958) asked executives from different departments to identify the most important problem in a business case, and found that they tended to identify problems related to their own function, a phenomenon they called selective perception. Walsh (1988) later found only weak support for this pattern in a larger study, suggesting that managers' belief structures are more varied than functional background alone predicts. The broader point, that people's position shapes what they see, remains important for interpreting stakeholder accounts.
Roth and Mehta (2002) described the "Rashomon effect", named after Kurosawa's film in which several witnesses give incompatible accounts of the same crime. In studying contested events, they argued, researchers should neither assume that one account is true nor treat all accounts as equally valid, but should analyse both what actually happened and why different participants understood it differently. Weick (1995) described sensemaking as the process by which people in organisations construct plausible interpretations of ambiguous events, and noted that these interpretations are shaped by identity, prior beliefs and social context.
People also tend to assume that others share their views. Ross et al. (1977) described the false consensus effect, the tendency to overestimate how common one's own opinions and behaviours are. A manager who believes customers value a feature may be confident that "everyone" agrees, even when many stakeholders do not.
For insight work, the implication is that conflicting stakeholder accounts should be collected and compared deliberately, not reconciled prematurely. Mitchell et al. (1997) argued that organisations tend to attend to stakeholders with power, legitimacy and urgency. Accounts from less powerful stakeholders, such as frontline staff or customers, may be overlooked even when they are more accurate about specific matters.
Why contradictions are often hidden
If contradictions are so informative, why do organisations so often fail to notice them? Part of the answer lies in how people process evidence. Kunda (1990) reviewed research on motivated reasoning and showed that when people want to reach a particular conclusion, they search memory and evidence selectively and apply stricter standards to information that challenges their preferred view. A team that has championed a product launch will tend to scrutinise the critical frontline account more harshly than the favourable dashboard.
Organisational structure adds to the problem. Data are often held in separate systems owned by separate teams, each reporting its own figures to its own audience. Nobody is responsible for comparing them, and contradictions surface only when two reports happen to land on the same desk. Even then, the usual response is to ask which number is "right" rather than why they differ.
Social pressures also suppress contradictory accounts. Morrison and Milliken (2000) described "organisational silence", a collective tendency for employees to withhold information about problems because they believe speaking up is futile or risky. Frontline staff who see a different reality from the one described in management reports may simply stop mentioning it. When an insight team collects accounts from different levels of the organisation, it should make clear that disagreement is welcome and that accounts will be reported without attributing them to individuals.
Building contradiction checks into routine reporting
Contradictions are easier to find when organisations look for them routinely rather than waiting for them to appear. Several practices help.
Reconcile key figures regularly. Where the same quantity, such as active customers, revenue or headcount, is reported from more than one system, a regular reconciliation that explains the differences prevents confusion and often reveals data problems early. A short note of the definitions used by each system, kept with the figures, avoids repeated arguments.
Pair attitudinal and behavioural measures. Reporting survey measures alongside the behaviour they are meant to predict, such as stated intention to renew alongside actual renewal, makes gaps visible. When the two diverge, the divergence becomes a topic for investigation.
Break results down by default. Showing key measures for major segments as well as overall makes aggregation effects such as Simpson's paradox easier to spot.
Collect accounts from several levels. When reviewing a project or a problem, gather views from senior managers, frontline staff and customers, and present them side by side.
These practices do not remove contradictions. They make them visible early, when they are cheaper to investigate and more likely to lead to useful change.
A process for working with contradictions
1. Look for contradictions deliberately. Compare sources that should tell the same story: survey results with behavioural data, one system's numbers with another's, managers' accounts with frontline accounts and customer feedback. Note where they disagree.
2. Describe the contradiction precisely. State exactly what each source says, for which population, period and definition. Many apparent contradictions dissolve at this step, because the sources turn out to be measuring different things.
3. Generate rival explanations. List the possible reasons for the disagreement, using the categories above. Heuer (1999) described the analysis of competing hypotheses, a method developed for intelligence analysis in which analysts list all plausible explanations and evaluate each piece of evidence against all of them, focusing on evidence that discriminates between hypotheses rather than evidence that is consistent with all of them.
4. Test the explanations. Check definitions, compare populations, align time periods, break results down by subgroup and examine data quality. Gather further evidence where needed, for example through follow-up interviews or a targeted analysis.
5. Report what the contradiction reveals. Whether the explanation is a data problem, a difference in populations or a real difference in perspective, it is a finding worth reporting. Where the contradiction cannot be resolved, report it honestly rather than presenting one side as the truth.
Using structured debate
Contradictory views can also be used deliberately in decision making. Mitroff and Emshoff (1979) proposed dialectical inquiry, in which a plan and a counter-plan based on opposing assumptions are developed and debated, so that hidden assumptions are exposed. Schweiger et al. (1986) compared dialectical inquiry, devil's advocacy and consensus approaches in experiments and found that the two approaches involving structured conflict produced higher-quality recommendations and assumptions than consensus, although participants found them less satisfying. Schwenk (1990) conducted a meta-analysis and found that devil's advocacy improved decision quality compared with expert-based approaches.
These methods suggest that contradictions should be brought into the open and examined, not suppressed. An insight team can play this role by presenting contradictory evidence side by side and asking decision makers to consider what each implies.
An example
Consider a hypothetical software company whose customer success team reports that customer health is strong: most accounts score well on its health index, and renewal forecasts are optimistic. The finance team, however, reports that revenue from renewals has fallen short of forecast for three consecutive quarters.
An analyst lays out the two accounts precisely. The health index is based on product usage and account manager judgement; the finance figures are based on actual renewals. Breaking down the data reveals that the health index is high for accounts with heavy usage by a few power users, but these accounts often fail to renew at full value because the wider organisation does not use the product. The health index measures intensity of use, not breadth, and account managers' judgements tend to be optimistic.
Interviews with customers who reduced their contracts confirm that the decision to renew was made by budget holders who saw limited adoption across their teams. The contradiction between the two teams' accounts leads to a better measure of customer health, one that includes breadth of adoption, and to a change in how account managers engage with budget holders.
The example also shows how the contradiction had been hidden. Each team reported accurately on its own measure, to its own leadership, for several quarters. The customer success team explained shortfalls as forecasting errors by finance; the finance team assumed the health index was simply optimistic. Neither looked at the accounts behind the other's numbers. It took a deliberate comparison, at the level of individual accounts rather than totals, to show that both sets of figures were correct and that the gap between them pointed to a real weakness in how customer health was being measured. Once the new measure was in place, the two teams' forecasts converged, and the remaining differences became a regular topic in their joint quarterly review.
Key takeaways
Contradictions between datasets and between stakeholder accounts are common and valuable. They usually arise from different definitions, populations, time periods, levels of aggregation, measurement error or genuinely different perspectives. Diagnosing which applies often reveals more than the original question. Gaps between what people say and what they do, and between the accounts of different stakeholders, are findings in their own right. A deliberate process of finding, describing, explaining and testing contradictions, supported by structured debate, turns disagreement into insight.
References
Bickel, P. J., Hammel, E. A., & O'Connell, J. W. (1975). Sex bias in graduate admissions: Data from Berkeley. Science, 187(4175), 398–404. https://doi.org/10.1126/science.187.4175.398
Campbell, D. T., & Fiske, D. W. (1959). Convergent and discriminant validation by the multitrait-multimethod matrix. Psychological Bulletin, 56(2), 81–105. https://doi.org/10.1037/h0046016
Dearborn, D. C., & Simon, H. A. (1958). Selective perception: A note on the departmental identifications of executives. Sociometry, 21(2), 140–144. https://doi.org/10.2307/2785898
Denzin, N. K. (1978). The research act: A theoretical introduction to sociological methods (2nd ed.). McGraw-Hill.
Erzberger, C., & Prein, G. (1997). Triangulation: Validity and empirically-based hypothesis construction. Quality & Quantity, 31(2), 141–154. https://doi.org/10.1023/A:1004249313062
Fetters, M. D., Curry, L. A., & Creswell, J. W. (2013). Achieving integration in mixed methods designs: Principles and practices. Health Services Research, 48(6, Pt. 2), 2134–2156. https://doi.org/10.1111/1475-6773.12117
Greene, J. C., Caracelli, V. J., & Graham, W. F. (1989). Toward a conceptual framework for mixed-method evaluation designs. Educational Evaluation and Policy Analysis, 11(3), 255–274. https://doi.org/10.3102/01623737011003255
Heuer, R. J., Jr. (1999). Psychology of intelligence analysis. Center for the Study of Intelligence, Central Intelligence Agency.
Jick, T. D. (1979). Mixing qualitative and quantitative methods: Triangulation in action. Administrative Science Quarterly, 24(4), 602–611. https://doi.org/10.2307/2392366
Kunda, Z. (1990). The case for motivated reasoning. Psychological Bulletin, 108(3), 480–498. https://doi.org/10.1037/0033-2909.108.3.480
LaPiere, R. T. (1934). Attitudes vs. actions. Social Forces, 13(2), 230–237. https://doi.org/10.2307/2570339
Mitchell, R. K., Agle, B. R., & Wood, D. J. (1997). Toward a theory of stakeholder identification and salience: Defining the principle of who and what really counts. Academy of Management Review, 22(4), 853–886. https://doi.org/10.5465/amr.1997.9711022105
Mitroff, I. I., & Emshoff, J. R. (1979). On strategic assumption-making: A dialectical approach to policy and planning. Academy of Management Review, 4(1), 1–12. https://doi.org/10.5465/amr.1979.4289165
Morrison, E. W., & Milliken, F. J. (2000). Organizational silence: A barrier to change and development in a pluralistic world. Academy of Management Review, 25(4), 706–725. https://doi.org/10.5465/amr.2000.3707697
Nisbett, R. E., & Wilson, T. D. (1977). Telling more than we can know: Verbal reports on mental processes. Psychological Review, 84(3), 231–259. https://doi.org/10.1037/0033-295X.84.3.231
Redman, T. C. (1998). The impact of poor data quality on the typical enterprise. Communications of the ACM, 41(2), 79–82. https://doi.org/10.1145/269012.269025
Ross, L., Greene, D., & House, P. (1977). The "false consensus effect": An egocentric bias in social perception and attribution processes. Journal of Experimental Social Psychology, 13(3), 279–301. https://doi.org/10.1016/0022-1031(77)90049-X
Roth, W. D., & Mehta, J. D. (2002). The Rashomon effect: Combining positivist and interpretivist approaches in the analysis of contested events. Sociological Methods & Research, 31(2), 131–173. https://doi.org/10.1177/0049124102031002002
Schweiger, D. M., Sandberg, W. R., & Ragan, J. W. (1986). Group approaches for improving strategic decision making: A comparative analysis of dialectical inquiry, devil's advocacy, and consensus. Academy of Management Journal, 29(1), 51–71. https://doi.org/10.5465/255859
Schwenk, C. R. (1990). Effects of devil's advocacy and dialectical inquiry on decision making: A meta-analysis. Organizational Behavior and Human Decision Processes, 47(1), 161–176. https://doi.org/10.1016/0749-5978(90)90051-A
Sheeran, P. (2002). Intention–behavior relations: A conceptual and empirical review. European Review of Social Psychology, 12(1), 1–36. https://doi.org/10.1080/14792772143000003
Simpson, E. H. (1951). The interpretation of interaction in contingency tables. Journal of the Royal Statistical Society: Series B (Methodological), 13(2), 238–241. https://doi.org/10.1111/j.2517-6161.1951.tb00088.x
Tourangeau, R., & Yan, T. (2007). Sensitive questions in surveys. Psychological Bulletin, 133(5), 859–883. https://doi.org/10.1037/0033-2909.133.5.859
Walsh, J. P. (1988). Selectivity and selective perception: An investigation of managers' belief structures and information processing. Academy of Management Journal, 31(4), 873–896. https://doi.org/10.5465/256343
Wang, R. Y., & Strong, D. M. (1996). Beyond accuracy: What data quality means to data consumers. Journal of Management Information Systems, 12(4), 5–33. https://doi.org/10.1080/07421222.1996.11518099
Webb, E. J., Campbell, D. T., Schwartz, R. D., & Sechrest, L. (1966). Unobtrusive measures: Nonreactive research in the social sciences. Rand McNally.
Weick, K. E. (1995). Sensemaking in organizations. SAGE.