
The Generation of Knowledge · Knowledge and decisions
Uncertainty, Probability, and Confidence Across Statistical, Intelligence, and Investigative Knowledge
How statisticians, intelligence analysts, investigators and courts each express uncertainty, what confidence intervals, estimative language, confidence levels and standards of proof really mean, the common errors in reading them and how to communicate uncertainty clearly across fields.
Every field that produces knowledge must say how sure it is. A statistician reports a margin of error, an intelligence analyst judges an event "likely", a forensic scientist states how strongly evidence supports one account over another and a court decides whether a case has been proved. These are all ways of expressing uncertainty, but they use different concepts, different words and different numbers. When findings travel between fields, or from experts to decision-makers, these differences can cause serious misunderstanding. This article compares how statistical, intelligence and investigative knowledge express uncertainty, describes common errors and draws lessons for communicating it clearly.
Two kinds of probability
Behind the different practices lie two ways of thinking about probability. In the frequentist view, probability describes how often something happens in a long run of repeated trials, such as the proportion of samples that would produce a given result. In the Bayesian view, probability describes a degree of belief, which can be applied to a single event or hypothesis and updated as evidence arrives (Gelman et al., 2013). Survey statistics have traditionally used the frequentist approach; intelligence analysis and forensic interpretation draw more on degrees of belief. Each approach answers a different question, and confusing them is a common source of error.
Uncertainty in statistics
Confidence intervals
Neyman (1937) developed the confidence interval. A 95% confidence interval is produced by a procedure that, if repeated across many samples, would capture the true value in 95% of them. It is a statement about the reliability of the method, not a direct statement about the probability that the true value lies within the particular interval obtained.
This distinction is widely misunderstood. Hoekstra et al. (2014) gave researchers and students a set of statements about a confidence interval, all of which were false, and found that most participants, including experienced researchers, endorsed at least some of them. A common misreading is to treat a 95% interval as having a 95% probability of containing the true value. A credible interval from Bayesian analysis does have that interpretation, but it depends on prior beliefs as well as the data (Gelman et al., 2013).
Significance and p-values
Statistical significance testing has also been widely misused. The American Statistical Association issued a statement warning that a p-value does not measure the probability that a hypothesis is true, nor the size or importance of an effect, and that scientific conclusions should not rest on whether a p-value passes a fixed threshold (Wasserstein & Lazar, 2016).
More than sampling error
In surveys, the margin of error usually reflects only sampling error, the variation that arises from studying a sample rather than the whole population. Groves and Lyberg (2010) described the total survey error framework, which also includes errors from incomplete coverage, non-response, measurement and processing. These errors are often larger than sampling error, but they are rarely captured in a reported margin of error. A precise-looking interval can therefore give a false impression of certainty.
Uncertainty in intelligence
Words of estimative probability
Intelligence analysts usually express judgements in words. Kent (1964) found that colleagues interpreted the same phrase, such as "serious possibility", as meaning very different probabilities, and proposed a standard set of terms linked to numerical ranges. Research has since confirmed the problem. Budescu and Wallsten (1985) found that individuals were fairly consistent in how they interpreted probability phrases, but that different people interpreted the same phrases very differently.
Likelihood and confidence
Modern intelligence standards separate two ideas: the likelihood of an event and the analyst's confidence in the judgement. In the United States, the analytic standards of the intelligence community require analysts to express both, and not to combine them in the same sentence in ways that confuse the reader (Office of the Director of National Intelligence, 2015). An analyst might judge an event "likely" but have only "low confidence" in that judgement, because the evidence is thin or the sources unreliable.
The Intergovernmental Panel on Climate Change adopted a similar approach. Its guidance links likelihood terms to probability ranges, as shown in Figure 1, and requires a separate statement of confidence based on the amount of evidence and the degree of agreement among sources (Mastrandrea et al., 2010).
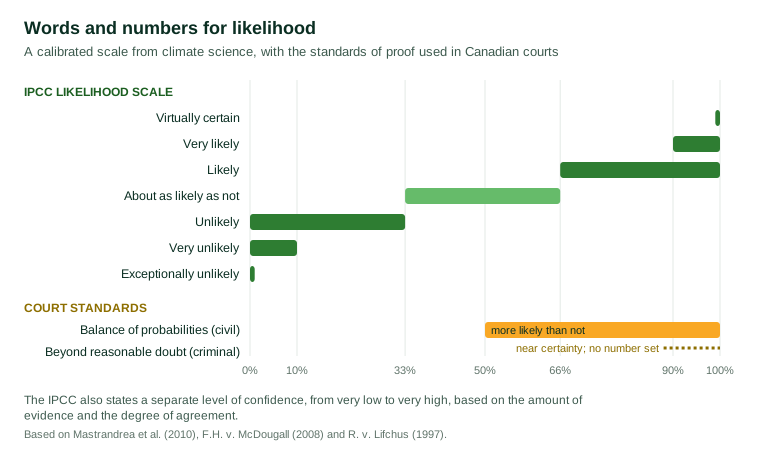
Even calibrated terms are not always read as intended. Budescu et al. (2009) asked members of the public to interpret sentences from IPCC reports and found that their interpretations of terms such as "very likely" were less extreme than the ranges the IPCC intended, and varied widely. Interpretations improved when numerical ranges were shown alongside the words.
Measuring accuracy
Friedman and Zeckhauser (2012) argued that intelligence estimates should be expressed as numerical probabilities where possible, because vague words prevent anyone from checking later whether the analysts were right. When numerical forecasts are recorded, accuracy can be measured. Mandel and Barnes (2014) analysed a large set of forecasts by Canadian strategic intelligence analysts and found them well calibrated, though somewhat underconfident. Tetlock and Gardner (2015) showed that forecasters who expressed fine-grained probabilities and updated them frequently were more accurate than those who used coarse categories.
Heuer (1999) recommended structured methods, such as the analysis of competing hypotheses, to help analysts consider evidence against every plausible explanation rather than only the one they favour, reducing overconfidence.
Uncertainty in investigation and law
Standards of proof
Courts must decide whether facts have been proved, and they use standards of proof that are expressed in words rather than numbers. In Canada, the Supreme Court has held that there is a single standard in civil cases: proof on a balance of probabilities, meaning that the fact is more likely than not (F.H. v. McDougall, 2008). In criminal cases, the Crown must prove guilt beyond a reasonable doubt. In R. v. Lifchus (1997), the Supreme Court of Canada explained that this standard is much closer to absolute certainty than to proof on a balance of probabilities, but declined to express it as a number. Juries are told that a reasonable doubt is one based on reason and common sense, not on sympathy or prejudice.
Weighing forensic evidence
Forensic scientists increasingly express the strength of evidence using a likelihood ratio: how much more probable the evidence is if one account is true (for example, that a suspect was the source of a trace) than if an alternative account is true (Evett & Weir, 1998). This approach separates the strength of the evidence, which is the scientist's concern, from the probability of guilt, which is for the court to decide in light of all the evidence. The Royal Statistical Society published guidance for lawyers and judges explaining these principles (Aitken et al., 2010).
A review by the National Research Council (2009) found that many forensic disciplines in the United States lacked a strong scientific basis for their claims of certainty, and that some examiners reported matches with a confidence that the underlying research did not support. It recommended that forensic reports state the uncertainty of their conclusions.
The prosecutor's fallacy
A notorious error in legal reasoning confuses two different probabilities. Thompson and Schumann (1987) described the prosecutor's fallacy: treating the probability of finding the evidence if the defendant were innocent as if it were the probability that the defendant is innocent given the evidence. If only 1 in 10,000 people would match a trace by chance, it does not follow that there is only a 1 in 10,000 chance that a matching defendant is innocent; in a city of a million people, about 100 others might also match. They also described the opposite defence attorney's fallacy, which wrongly dismisses such evidence as nearly worthless.
Common errors across fields
Although the vocabulary differs, the same mistakes recur.
Reversing conditional probabilities. The prosecutor's fallacy in law has close parallels in statistics, where a p-value, the probability of the data if a hypothesis were true, is mistaken for the probability that the hypothesis is true.
Mixing likelihood and confidence. A judgement that an event is probable may rest on strong or weak evidence; failing to say which leaves readers unable to weigh it.
Reporting only part of the uncertainty. Margins of error that cover only sampling error, and forensic conclusions that omit error rates, understate true uncertainty.
Vague verbal terms. Words such as "possible" or "likely" mean different things to different readers unless linked to numbers.
Overconfidence. Tversky and Kahneman (1974) showed that people's judgements of probability are shaped by heuristics that can produce systematic overconfidence.
Communicating uncertainty well
Van der Bles et al. (2019) proposed a framework for communicating uncertainty about facts, numbers and science. They distinguished uncertainty about the object (a fact, a number or a scientific hypothesis), its source and its level, and the form in which it is expressed, from full probability distributions to ranges, verbal summaries and simple acknowledgement that uncertainty exists. Spiegelhalter (2017) recommended expressing probabilities as frequencies where possible, showing ranges rather than single figures, and being honest about the quality of the underlying evidence.
Several practical lessons follow for anyone who reports findings across fields:
- State what is uncertain and why, distinguishing sampling error from other sources of error.
- Give numbers alongside words, and use a consistent scale of verbal terms.
- Separate how likely a conclusion is from how strong the evidence behind it is.
- Avoid reversing conditional probabilities; say clearly which probability is being reported.
- Record judgements and forecasts so that their accuracy can be checked later.
Implications for survey and research reports
Survey reports often present percentages to a decimal place, with a margin of error that covers only sampling. Readers may take these figures as more certain than they are. A clearer report would explain what the margin of error covers, note other possible sources of error, use consistent language for how confident the researchers are in each conclusion and distinguish findings based on strong evidence from those based on small subgroups or uncertain measures. Drawing on the practices of intelligence analysis and forensic science, researchers can separate the statistical precision of an estimate from their overall confidence in the conclusion, making clear to clients how much weight each finding can bear.
For example, a report might state that 42% of customers are very satisfied, with a margin of sampling error of about 3 percentage points, and then add that the survey reached customers only by email and that those without email addresses may differ. It might conclude that satisfaction has very likely fallen since last year, with high confidence, because the decline appears in every subgroup and in two independent measures, while noting that a difference between regions is about as likely as not to be real, with low confidence, because the regional samples are small.
Conclusion
Statistics, intelligence analysis and legal investigation have each developed ways of expressing uncertainty: confidence intervals and p-values, estimative language with separate levels of confidence, standards of proof and likelihood ratios. Each is designed for its own purpose, but each is easily misread, and all are vulnerable to the same errors of reversed probabilities, vague language, incomplete accounts of error and overconfidence. The remedies are also shared: link words to numbers, separate likelihood from confidence, report all important sources of error and test judgements against outcomes. Knowledge is most useful when its uncertainty is stated as clearly as its conclusions.
References
Aitken, C., Roberts, P., & Jackson, G. (2010). Fundamentals of probability and statistical evidence in criminal proceedings: Guidance for judges, lawyers, forensic scientists and expert witnesses (Practitioner Guide No. 1). Royal Statistical Society.
Budescu, D. V., Broomell, S., & Por, H.-H. (2009). Improving communication of uncertainty in the reports of the Intergovernmental Panel on Climate Change. Psychological Science, 20(3), 299–308. https://doi.org/10.1111/j.1467-9280.2009.02284.x
Budescu, D. V., & Wallsten, T. S. (1985). Consistency in interpretation of probabilistic phrases. Organizational Behavior and Human Decision Processes, 36(3), 391–405. https://doi.org/10.1016/0749-5978(85)90007-X
Evett, I. W., & Weir, B. S. (1998). Interpreting DNA evidence: Statistical genetics for forensic scientists. Sinauer Associates.
F.H. v. McDougall, 2008 SCC 53, [2008] 3 S.C.R. 41.
Friedman, J. A., & Zeckhauser, R. (2012). Assessing uncertainty in intelligence. Intelligence and National Security, 27(6), 824–847. https://doi.org/10.1080/02684527.2012.708275
Gelman, A., Carlin, J. B., Stern, H. S., Dunson, D. B., Vehtari, A., & Rubin, D. B. (2013). Bayesian data analysis (3rd ed.). CRC Press.
Groves, R. M., & Lyberg, L. (2010). Total survey error: Past, present, and future. Public Opinion Quarterly, 74(5), 849–879. https://doi.org/10.1093/poq/nfq065
Heuer, R. J., Jr. (1999). Psychology of intelligence analysis. Center for the Study of Intelligence, Central Intelligence Agency.
Hoekstra, R., Morey, R. D., Rouder, J. N., & Wagenmakers, E.-J. (2014). Robust misinterpretation of confidence intervals. Psychonomic Bulletin & Review, 21(5), 1157–1164. https://doi.org/10.3758/s13423-013-0572-3
Kent, S. (1964). Words of estimative probability. Studies in Intelligence, 8(4), 49–65.
Mandel, D. R., & Barnes, A. (2014). Accuracy of forecasts in strategic intelligence. Proceedings of the National Academy of Sciences, 111(30), 10984–10989. https://doi.org/10.1073/pnas.1406138111
Mastrandrea, M. D., Field, C. B., Stocker, T. F., Edenhofer, O., Ebi, K. L., Frame, D. J., Held, H., Kriegler, E., Mach, K. J., Matschoss, P. R., Plattner, G.-K., Yohe, G. W., & Zwiers, F. W. (2010). Guidance note for lead authors of the IPCC Fifth Assessment Report on consistent treatment of uncertainties. Intergovernmental Panel on Climate Change.
National Research Council. (2009). Strengthening forensic science in the United States: A path forward. National Academies Press. https://doi.org/10.17226/12589
Neyman, J. (1937). Outline of a theory of statistical estimation based on the classical theory of probability. Philosophical Transactions of the Royal Society of London. Series A, Mathematical and Physical Sciences, 236(767), 333–380. https://doi.org/10.1098/rsta.1937.0005
Office of the Director of National Intelligence. (2015). Intelligence Community Directive 203: Analytic standards. Office of the Director of National Intelligence.
R. v. Lifchus, [1997] 3 S.C.R. 320.
Spiegelhalter, D. (2017). Risk and uncertainty communication. Annual Review of Statistics and Its Application, 4, 31–60. https://doi.org/10.1146/annurev-statistics-010814-020148
Tetlock, P. E., & Gardner, D. (2015). Superforecasting: The art and science of prediction. Crown.
Thompson, W. C., & Schumann, E. L. (1987). Interpretation of statistical evidence in criminal trials: The prosecutor's fallacy and the defense attorney's fallacy. Law and Human Behavior, 11(3), 167–187. https://doi.org/10.1007/BF01044641
Tversky, A., & Kahneman, D. (1974). Judgment under uncertainty: Heuristics and biases. Science, 185(4157), 1124–1131. https://doi.org/10.1126/science.185.4157.1124
van der Bles, A. M., van der Linden, S., Freeman, A. L. J., Mitchell, J., Galvao, A. B., Zaval, L., & Spiegelhalter, D. J. (2019). Communicating uncertainty about facts, numbers and science. Royal Society Open Science, 6(5), Article 181870. https://doi.org/10.1098/rsos.181870
Wasserstein, R. L., & Lazar, N. A. (2016). The ASA statement on p-values: Context, process, and purpose. The American Statistician, 70(2), 129–133. https://doi.org/10.1080/00031305.2016.1154108