
The Generation of Knowledge · Knowledge production
Integrating Surveys, Research, and Statistics into a Coherent Evidence Base
How to combine survey results, qualitative research, published studies, administrative records and statistical models into a single body of evidence, using triangulation, mixed methods, systematic review, data linkage and explicit judgements of strength, so that decisions rest on the whole of what is known.
Few important questions can be answered by a single study. A company deciding whether to enter a new market may have a survey of potential customers, interviews with distributors, published industry statistics, its own sales data and academic research on consumer behaviour. A government designing a health programme may have national surveys, hospital records, clinical trials and evaluations of similar programmes elsewhere. Each source tells part of the story, and each has its own strengths and errors. The task is to combine them into a coherent evidence base: an organised body of knowledge in which the pieces are connected, their quality is assessed and their agreements and disagreements are understood.
This article describes the main methods for integrating evidence from different sources, the principles behind them and the practical steps that organisations can take to build an evidence base on which decisions can safely rest.
Why integrate?
There are three main reasons to combine evidence from several sources.
To strengthen conclusions. When different methods with different weaknesses point to the same answer, the answer is more trustworthy than any one method could make it. Munafò and Davey Smith (2018) argued that robust research needs many lines of evidence, and that repeating the same kind of study, however carefully, cannot rule out the biases shared by all studies of that kind.
To complete the picture. Different sources answer different parts of a question. A survey can measure how many people hold a view; interviews can explain why; administrative data can show what people actually did; experiments can test what causes what.
To detect error. When sources disagree, the disagreement is informative. It may reveal a measurement problem in one source, a difference in the populations covered or a real difference that needs explaining.
Triangulation
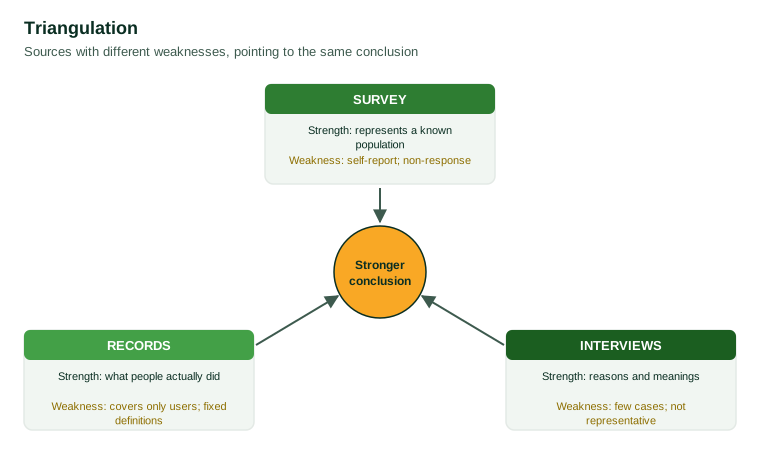
The oldest and most general principle of integration is triangulation, named after the surveyor's technique of fixing a position by taking bearings from two or more known points. Webb et al. (1966) argued that because every method of measurement has its own biases, confidence in a finding grows when it is confirmed by methods whose weaknesses are different. Denzin (1970) distinguished several forms of triangulation: using different data sources, different investigators, different theories and different methods to study the same phenomenon.
Lawlor et al. (2016) made the principle more precise for research on causes. They argued that triangulation is most powerful when the approaches being compared have different and unrelated sources of potential bias. If an observational survey, a natural experiment and a genetic study all suggest the same causal effect, and each would be biased in a different direction if its assumptions failed, then it is unlikely that all three are wrong in the same way. The key is not simply to collect more evidence, but to collect evidence whose errors are independent.
Mixed methods
Research that deliberately combines quantitative and qualitative methods within a single study is called mixed methods research. Greene et al. (1989) identified five purposes for mixing methods: triangulation, seeking convergence; complementarity, using one method to elaborate or clarify the results of another; development, using the results of one method to design another, as when interviews inform a questionnaire; initiation, seeking contradictions that prompt new questions; and expansion, extending the breadth of a study by using different methods for different parts.
Creswell and Plano Clark (2018) described common designs. In a convergent design, quantitative and qualitative data are collected at the same time and compared. In an explanatory sequential design, a survey comes first and interviews follow to explain its results. In an exploratory sequential design, qualitative research comes first and informs the development of a survey or measure.
Mixing methods does not guarantee integration. Bryman (2006) analysed several hundred published mixed methods studies and found that many presented quantitative and qualitative results side by side without genuinely bringing them together. Integration requires deliberate work: comparing results directly, explaining agreements and disagreements and drawing conclusions that use both.
Combining many studies: systematic review and meta-analysis
When many studies of the same question exist, they can be combined systematically. A systematic review uses explicit, reproducible methods to find all relevant studies, assess their quality and summarise their results. The Cochrane Handbook sets out these methods in detail for reviews of health interventions, including how to search for studies, extract data, assess risk of bias and synthesise results (Higgins et al., 2019).
When studies report comparable quantitative results, meta-analysis combines them statistically. Borenstein et al. (2009) explained how meta-analysis estimates an overall effect, weights each study by its precision and measures how much results vary between studies. Variation between studies is often as informative as the average, because it may reveal that an effect differs between populations, settings or methods.
Not all evidence comes from comparable studies. Pawson (2006) developed realist synthesis, which asks not simply whether an intervention works but what works, for whom, in what circumstances and why. It draws on diverse evidence, including qualitative studies and programme documents, to build and test explanations of how programmes produce their effects.
Combining surveys with other data
Surveys are increasingly combined with administrative records and other data sources. Groves (2011) described this as a defining feature of the current era of survey research. Citro (2014) argued that official statistical agencies should move from treating surveys as the main source of statistics to combining multiple data sources, with surveys as one important component.
Lohr and Raghunathan (2017) reviewed statistical methods for combining survey data with other sources. They include record linkage, joining survey responses to administrative records for the same individuals; small area estimation, using models and auxiliary data to produce reliable estimates for groups or areas too small to be measured precisely by a survey alone; and methods for combining estimates from several surveys.
Record linkage
Linking records from different sources allows richer analysis than either source alone. Fellegi and Sunter (1969) developed the statistical theory of probabilistic record linkage, which uses the agreement of several imperfect identifiers, such as names, dates of birth and addresses, to estimate the probability that two records refer to the same person. Harron et al. (2017) reviewed the challenges of linking administrative data for research, including linkage errors that can bias results, restrictions on access and the need to protect privacy. Linkage generally requires the informed consent of survey respondents or a clear legal basis, and strong safeguards for the data.
Small area estimation
Surveys often cannot provide precise estimates for small groups or local areas, because too few respondents come from each. Rao and Molina (2015) described methods of small area estimation that "borrow strength" by combining direct survey estimates with information from administrative data or census records through statistical models. These methods allow, for example, local estimates of poverty or health behaviours from national surveys.
Judging the strength of combined evidence
Combining evidence requires judging how much weight each piece deserves and how strong the overall conclusion is.
Criteria for causal inference
Hill (1965) proposed a set of considerations for judging whether an observed association is likely to be causal. They include the strength of the association, its consistency across studies and settings, its temporality (the cause must come before the effect), the presence of a dose–response relationship, its plausibility and coherence with other knowledge, and supporting experimental evidence. Hill stressed that these were viewpoints to help judgement, not rules that could be applied mechanically. They remain a useful checklist for integrating diverse evidence about causes.
Rating certainty
The GRADE approach, developed for health research, offers a structured way to rate the certainty of a body of evidence. Guyatt et al. (2008) described how evidence is rated as high, moderate, low or very low certainty, starting from the type of study design and then adjusting for factors such as risk of bias, inconsistency between studies, indirectness, imprecision and possible publication bias. The approach makes judgements about evidence explicit and comparable.
Validity for the decision at hand
Evidence that something worked in one place does not guarantee that it will work elsewhere. Cartwright and Hardie (2012) argued that decision-makers need evidence not only that an intervention worked in studies, but that the conditions that made it work are present in their own setting. Shadish et al. (2002) distinguished internal validity, whether a study correctly identifies an effect in its own setting, from external validity, whether the effect generalises to other people, places and times. Integrating evidence for a decision requires attention to both.
Building a coherent evidence base in practice
For organisations that produce or use research, the methods above suggest a practical approach.
1. Define the questions. Set out the decision and the specific questions on which it depends. Each question may need different evidence.
2. Map existing evidence. Before collecting new data, gather what is already known: previous surveys, internal data, published research and official statistics. Record where each piece came from and how it was produced.
3. Assess each source. Judge each source's quality and relevance using a consistent framework, such as the total survey error framework for surveys (Biemer, 2010) or risk-of-bias criteria for studies. Note what population, time and definitions each covers.
4. Fill gaps deliberately. Design new data collection to answer questions that existing evidence cannot, and, where possible, choose methods whose weaknesses differ from those of existing sources.
5. Compare and reconcile. Place results from different sources side by side. Where they agree, the conclusion is strengthened. Where they disagree, investigate why: differences in definitions, populations, timing or error.
6. Rate the overall strength. Summarise how confident one can be in each conclusion, and why, using explicit criteria.
7. Keep it current. Treat the evidence base as a living resource. Add new findings, mark superseded ones and revisit conclusions when the evidence changes.
An illustration: when sources disagree
Consider a retailer that wants to know whether a loyalty programme is increasing customer spending. A customer survey finds that members say they shop more often since joining. The company's transaction records show that members do spend more than non-members, but they also spent more before they joined. Interviews with a small number of customers suggest that many joined because they were already frequent shoppers and wanted the discounts.
Taken alone, each source supports a different conclusion. The survey suggests the programme works; the records suggest that members were different from the start; the interviews offer a reason for that difference. Integrated, they point to a more careful answer: much of the apparent effect of the programme reflects who chose to join, and its true effect is probably smaller than the survey implies. A further step would be to design a test, for example by offering the programme to a randomly chosen group of non-members and comparing their spending with that of a similar group not offered it.
Salganik (2018) argued that combining the scale of records generated by everyday activity with the precision of designed surveys and experiments is among the most powerful approaches available to social researchers. The illustration shows why. Each source has a characteristic weakness: self-report in the survey, self-selection in the records, small numbers in the interviews. Only by setting them against one another does the true picture emerge, and only by understanding why they disagree can the next piece of evidence be designed to resolve the question.
Common pitfalls
Counting rather than weighing. Ten weak studies that agree do not outweigh one strong study that disagrees. Evidence should be weighed by quality, not counted.
Hiding disagreement. Presenting only the sources that agree gives a false impression of certainty. Disagreements should be reported and explained.
Mixing incompatible measures. Combining figures that use different definitions or populations without adjustment produces misleading totals and trends.
Ignoring shared biases. Several sources that share the same weakness, such as relying on the same self-reported measure, do not provide independent confirmation.
Conclusion
A coherent evidence base is more than a collection of studies. It is an organised body of knowledge in which sources are assessed, compared and combined, and in which the strength of each conclusion is explicit. Triangulation, mixed methods, systematic review, data linkage and structured judgements of certainty provide the tools. The underlying principle is simple: no single source is free of error, but sources with different errors, combined with care, can produce knowledge more reliable than any of them alone. For organisations that make decisions on the basis of research, building such an evidence base is the surest way to make those decisions well.
References
Biemer, P. P. (2010). Total survey error: Design, implementation, and evaluation. Public Opinion Quarterly, 74(5), 817–848. https://doi.org/10.1093/poq/nfq058
Borenstein, M., Hedges, L. V., Higgins, J. P. T., & Rothstein, H. R. (2009). Introduction to meta-analysis. Wiley. https://doi.org/10.1002/9780470743386
Bryman, A. (2006). Integrating quantitative and qualitative research: How is it done? Qualitative Research, 6(1), 97–113. https://doi.org/10.1177/1468794106058877
Cartwright, N., & Hardie, J. (2012). Evidence-based policy: A practical guide to doing it better. Oxford University Press.
Citro, C. F. (2014). From multiple modes for surveys to multiple data sources for estimates. Survey Methodology, 40(2), 137–161.
Creswell, J. W., & Plano Clark, V. L. (2018). Designing and conducting mixed methods research (3rd ed.). SAGE.
Denzin, N. K. (1970). The research act: A theoretical introduction to sociological methods. Aldine.
Fellegi, I. P., & Sunter, A. B. (1969). A theory for record linkage. Journal of the American Statistical Association, 64(328), 1183–1210. https://doi.org/10.1080/01621459.1969.10501049
Greene, J. C., Caracelli, V. J., & Graham, W. F. (1989). Toward a conceptual framework for mixed-method evaluation designs. Educational Evaluation and Policy Analysis, 11(3), 255–274. https://doi.org/10.3102/01623737011003255
Groves, R. M. (2011). Three eras of survey research. Public Opinion Quarterly, 75(5), 861–871. https://doi.org/10.1093/poq/nfr057
Guyatt, G. H., Oxman, A. D., Vist, G. E., Kunz, R., Falck-Ytter, Y., Alonso-Coello, P., & Schünemann, H. J. (2008). GRADE: An emerging consensus on rating quality of evidence and strength of recommendations. BMJ, 336(7650), 924–926. https://doi.org/10.1136/bmj.39489.470347.AD
Harron, K., Dibben, C., Boyd, J., Hjern, A., Azimaee, M., Barreto, M. L., & Goldstein, H. (2017). Challenges in administrative data linkage for research. Big Data & Society, 4(2). https://doi.org/10.1177/2053951717745678
Higgins, J. P. T., Thomas, J., Chandler, J., Cumpston, M., Li, T., Page, M. J., & Welch, V. A. (Eds.). (2019). Cochrane handbook for systematic reviews of interventions (2nd ed.). Wiley. https://doi.org/10.1002/9781119536604
Hill, A. B. (1965). The environment and disease: Association or causation? Proceedings of the Royal Society of Medicine, 58(5), 295–300. https://doi.org/10.1177/003591576505800503
Lawlor, D. A., Tilling, K., & Davey Smith, G. (2016). Triangulation in aetiological epidemiology. International Journal of Epidemiology, 45(6), 1866–1886. https://doi.org/10.1093/ije/dyw314
Lohr, S. L., & Raghunathan, T. E. (2017). Combining survey data with other data sources. Statistical Science, 32(2), 293–312. https://doi.org/10.1214/16-STS584
Munafò, M. R., & Davey Smith, G. (2018). Robust research needs many lines of evidence. Nature, 553(7689), 399–401. https://doi.org/10.1038/d41586-018-01023-3
Pawson, R. (2006). Evidence-based policy: A realist perspective. SAGE.
Rao, J. N. K., & Molina, I. (2015). Small area estimation (2nd ed.). Wiley. https://doi.org/10.1002/9781118735855
Salganik, M. J. (2018). Bit by bit: Social research in the digital age. Princeton University Press.
Shadish, W. R., Cook, T. D., & Campbell, D. T. (2002). Experimental and quasi-experimental designs for generalized causal inference. Houghton Mifflin.
Webb, E. J., Campbell, D. T., Schwartz, R. D., & Sechrest, L. (1966). Unobtrusive measures: Nonreactive research in the social sciences. Rand McNally.