
Surveys · Technology and the future
Voice and Video Responses in Online Surveys
Online surveys can now record spoken answers and video, and some interviews are conducted by live video. This article explains how voice and video responses work, what research shows about their effects on answers and participation, the privacy and analysis challenges they bring and how to use them well.
For most of its history, online survey research has been a written exchange. Respondents read questions on a screen and answer by clicking options or typing text. Smartphones have changed what is possible. Every phone has a microphone and a camera, and respondents are used to sending voice messages and short videos to friends. Survey researchers have begun to use these features, asking respondents to speak their answers rather than type them, to record short videos, or to take part in interviews conducted by live video.
These new forms of response promise richer answers, easier participation for people who find typing difficult and a closer link between online surveys and the conversational character of interviews. They also raise new questions about who will take part, how answers change when spoken rather than written, how to analyse recordings and how to protect respondents' privacy. This article reviews what is known so far.
Forms of voice and video response
Figure 1 summarises the main forms that voice and video take in survey research.
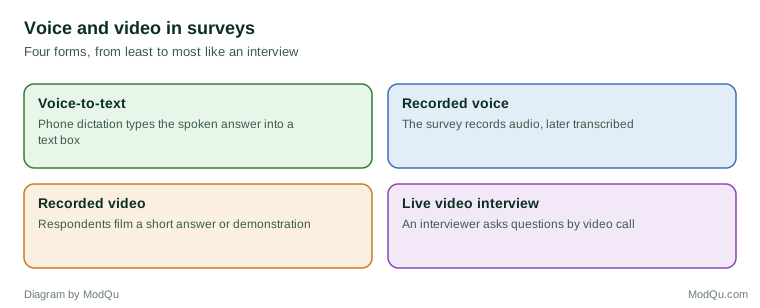
Voice-to-text input. Most smartphone keyboards include a dictation function that converts speech into text. A respondent can tap the microphone and speak an answer into an ordinary text box. The survey receives text, not sound. This requires no change to the survey, but respondents must know about the feature and choose to use it.
Recorded voice answers. The survey itself includes a recording button. The respondent speaks the answer, and the audio file is sent to the researcher. The recording may later be converted to text by automatic speech recognition, but the original audio is kept.
Recorded video answers. The respondent records a short video, for example showing a product in use or explaining a view. Video adds facial expression, gesture and setting to the spoken words.
Live video interviews. An interviewer conducts the interview through a video call. This combines features of face-to-face and telephone interviewing and became much more common when in-person fieldwork was restricted during the COVID-19 pandemic.
A related form, the prerecorded video interviewer, shows a recorded video of an interviewer asking each question, while the respondent answers by clicking or typing. This tests whether seeing a human face changes answers without the cost of live interviewers.
From audio recorders to smartphones
Voice and computer technology have been part of survey research for decades. Interviewers once used tape recorders to capture open-ended answers in full, and recordings of interviews have long been used to check interviewer performance. In the 1990s, audio computer-assisted self-interviewing allowed respondents to listen to recorded questions through headphones and answer privately on a computer, even when an interviewer was present in the room. Turner et al. (1998) found that young men interviewed this way reported much higher rates of sensitive behaviours, such as drug use and violence, than those who answered on paper. That work showed that how questions are delivered and answered, not only what is asked, shapes the answers.
Smartphones have turned these specialised tools into everyday features. Couper (2017) described how mobile devices allow surveys to collect new kinds of data, including photographs, recordings and sensor data, alongside traditional answers, and noted that each new form raises questions about measurement, participation and consent. Voice and video responses are one part of this wider change. The difference now is that respondents control the device and the setting: they decide where to answer, whether others are present and whether to speak at all.
Why spoken answers may differ from written ones
Speaking and writing are different activities. Spoken language tends to be more informal, more repetitive and more personal, while written language is more compact and more carefully structured (Chafe & Tannen, 1987). Speaking is faster than typing, especially on a small phone keyboard. People may therefore say more than they would write and include details, examples and feelings they would leave out of a typed answer.
Getting full answers to open-ended questions in web surveys has long been a challenge. Smyth et al. (2009) found that larger answer boxes and short motivating instructions encouraged longer, more informative typed answers. Revilla and Ochoa (2016) found that typed open answers given on smartphones tended to be shorter than those given on computers. Voice answers offer a way around the difficulty of typing on phones.
Speaking also changes the process of answering. Written answers can be revised before they are sent; spoken answers are usually given in one attempt. This may make spoken answers more spontaneous and less edited. Whether that improves or reduces quality depends on the purpose: spontaneous answers may better reflect first reactions, while edited answers may be more precise.
What research has found
Willingness and participation
The main obstacle so far is that many respondents prefer not to speak their answers. Revilla et al. (2020) offered smartphone respondents in an online panel in Spain the option of answering open-ended questions by voice recording. Many respondents did not use the voice option, some reported technical problems, and those who did use it differed from those who did not. When voice was the only way to answer, more respondents skipped the question or left the survey. Revilla and Couper (2021) tested ways to improve the use of voice recording, such as clearer instructions and encouragement, with modest effects.
Several reasons for reluctance are likely. Respondents may be in places where speaking aloud is inconvenient or would be overheard, such as on public transport or at work. Some feel self-conscious about recording their voice. Others may worry about how the recording will be used. Typing, by contrast, is private and familiar in the survey context.
Length and content of answers
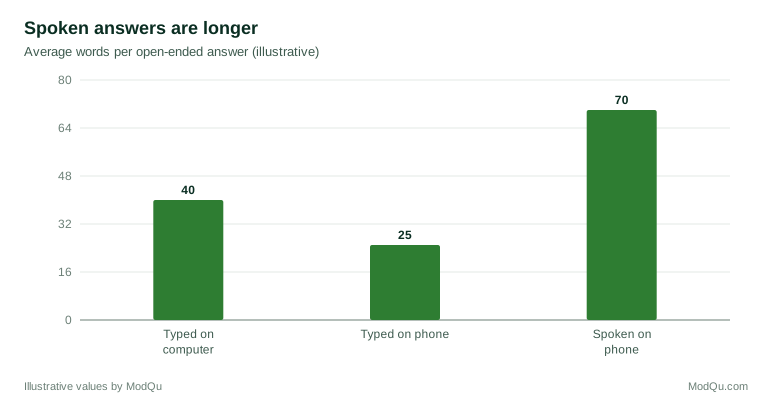
When respondents do answer by voice, the answers are usually longer. Gavras et al. (2022) compared written and spoken answers to open questions about political attitudes in a German online panel. Spoken answers were longer, contained more topics and were more conversational in style. Gavras and Höhne (2022) found that both spoken and typed answers to open questions about political parties were related to closed measures of the same attitudes, which suggests that voice answers can be valid measures, not just longer ones.
Figure 2 illustrates the kind of difference reported between modes.
Disclosure of sensitive information
A well-established finding in survey research is that respondents report more sensitive behaviour when no interviewer is present, because there is less pressure to give socially desirable answers (Tourangeau & Smith, 1996; Tourangeau & Yan, 2007; Kreuter et al., 2008). Voice and video may move a self-administered survey closer to an interview. Speaking an answer aloud, or seeing a human face, may bring back some of the social pressure that typing in private removes.
Research on text and voice interviews supports this concern. Schober et al. (2015) compared interviews on smartphones conducted by text message and by voice, with either a human or an automated interviewer. Respondents disclosed more sensitive information in text interviews than in voice interviews, and gave more precise answers to numerical questions. Lind et al. (2013) examined why respondents disclose more when computers ask the questions and found that the absence of a human, and the feeling that no one is evaluating the answer, both mattered.
Video interviewers have been tested directly. Conrad et al. (2015) found that animated virtual interviewers with more human-like facial movement increased engagement but affected answers to some questions. West et al. (2022) compared live video interviews with self-interviews in which a prerecorded video interviewer read the questions. Interviewers had measurable effects on answers in the live video interviews, as they do in face-to-face interviews. Conrad et al. (2023) found that respondents in prerecorded video self-interviews disclosed more sensitive information than respondents in live video interviews, and that many respondents were satisfied with both modes. Lucas et al. (2014) found that people were more willing to disclose to a virtual human when they believed it was controlled by a computer rather than a person.
Live video compared with other modes
Live video interviews have been compared with other modes in randomised experiments. Endres et al. (2023) randomly assigned respondents to live video interviews or to online self-completion and found differences in answers to some sensitive questions, consistent with greater social desirability in the video interviews, though answers to most questions were similar. Live video may therefore be a reasonable substitute for face-to-face interviewing where an interviewer is needed, but it is not equivalent to self-completion.
Analysing voice and video data
Transcription
Recorded voice answers are usually converted to text before analysis. Automatic speech recognition has improved greatly and can transcribe large numbers of recordings quickly. But it makes errors, especially with background noise, strong accents, dialects and people who speak unclearly. Koenecke et al. (2020) found that several commercial speech recognition systems made substantially more errors for Black American speakers than for white speakers. In a survey, such differences could cause answers from some groups to be misunderstood or lost, introducing bias. Researchers should check transcription quality on a sample of recordings, especially for groups at risk of higher error rates.
Coding and text analysis
Once transcribed, spoken answers can be coded like written ones. Because spoken answers are longer and less structured, coding takes more effort. Semi-automated approaches, in which a computer codes clear cases and human coders handle the rest, can reduce the workload (Schonlau & Couper, 2016). Topic models can identify themes across many answers (Roberts et al., 2014). Coding frames developed for written answers may need adjustment, because spoken answers often cover several topics, include hesitations and change direction.
Using the audio itself
Recordings contain information beyond words: tone, speed, pauses and hesitations. Some researchers are exploring whether these features indicate uncertainty or emotion. Such uses should be approached with caution. Research on facial expressions has shown that inferring emotions from observable signals is far less reliable than often assumed, because the same expression can reflect different emotions in different people and contexts (Barrett et al., 2019). Similar concerns apply to the voice. Any claim that a survey can detect respondents' emotions from audio or video should be treated as an untested hypothesis, not a measurement.
Video data
Video answers are richer still and harder to analyse. They are often used in market research to show how consumers use a product or to present respondents' views in their own words to clients. For such purposes, a small number of well-chosen videos may be more useful than systematic coding of many. When video is analysed systematically, researchers need clear coding rules and checks on agreement between coders.
Privacy and ethics
Voice and video recordings are more identifying than typed answers. A voice can be recognised by people who know the speaker, and a face can be recognised by anyone. Recordings may also capture other people, such as family members in the background, and details of the respondent's home. In some jurisdictions, voice and facial data used to identify people are treated as special categories of personal data with additional legal protection (European Parliament & Council of the European Union, 2016).
These features call for particular care:
- Specific consent. Respondents should agree specifically to being recorded and be told how recordings will be stored, who will hear or see them and for how long they will be kept.
- Separate storage. Recordings should be stored securely and separately from other identifying information.
- Limited use. If recordings are only needed for transcription, they can be deleted once transcripts have been checked. If they will be shown to clients, respondents must agree to this explicitly.
- An alternative. Respondents who do not wish to be recorded should be able to type their answer instead, to avoid excluding them or forcing them to break off.
- Care with third parties. If recordings are sent to an external transcription or analysis service, the data protection implications must be checked.
Respondents' concerns about privacy also affect participation. Research on collecting other kinds of data through smartphones shows that willingness depends on trust in the organisation, the perceived sensitivity of the data and the control respondents have over it (Keusch et al., 2019). Similar factors are likely to affect willingness to be recorded.
Designing voice and video questions
Evidence so far suggests several practices:
- Use voice and video selectively. Reserve them for open questions where rich, detailed answers are valuable, such as experiences, explanations or reactions to a product. Closed questions gain little from voice.
- Offer a choice. Let respondents choose between speaking and typing. Making voice compulsory increases breakoff and item nonresponse (Revilla et al., 2020).
- Explain and encourage. Tell respondents why a spoken answer is useful, how long it should be and how the recording will be used. Show them how to record and allow them to listen and re-record before sending.
- Test the technology. Recording must work on many phone models, browsers and operating systems. Test on the devices respondents use and provide clear messages if recording fails.
- Plan the analysis. Budget for transcription, checking and coding. Decide in advance whether the audio itself will be analysed or only the words.
- Consider sensitive topics carefully. For sensitive questions, typed answers or self-completion may produce more honest reports than voice or video.
- Record which mode was used. Keep a variable showing whether each answer was spoken or typed, so that analysts can check for differences.
Live video interviewing in practice
Live video interviews raise their own practical issues. Respondents need a suitable device, a reliable internet connection and some familiarity with video calls, which may exclude some older, poorer or rural respondents. Interviewers need training in managing video calls, including technical problems and the different social cues of a screen conversation. Scheduling can be easier than for face-to-face interviews because no travel is needed, but missed appointments may be more common.
Show cards, which are often used in face-to-face interviews to present response options, can be shared on screen. Measurements that require physical presence, such as blood pressure, cannot easily be taken. Live video interviews are thus best seen as a separate mode with its own strengths and weaknesses, not a direct replacement for in-person interviews.
Where voice and video fit best
The value of voice and video differs between types of research. In market and customer research, where the aim is often to understand experiences and reactions in depth, rich spoken answers and short videos can be highly useful, and clients often value hearing customers in their own words. In academic and official surveys, where the priority is accurate estimates for a whole population, the selective participation and possible mode effects described above weigh more heavily. There, voice is more likely to be offered as an optional way of answering a few open questions than as a central feature of the questionnaire.
Voice input may also help include people who find typing difficult, such as some older respondents, people with certain disabilities and people with limited literacy. For these groups, the ability to speak an answer may make the difference between taking part and not. Offering voice as an option, alongside typing, can therefore improve accessibility as well as the richness of answers.
An example
A consumer research company wants to understand how people use a new kitchen appliance. In an online survey of 1,200 owners, it adds an open question: "Please describe the last time you used the appliance and anything that was difficult." Respondents on phones are offered a choice between typing and recording a voice answer.
About one in five phone respondents chooses voice. Their answers average 70 words, compared with 25 words for typed answers on phones and 40 on computers. Voice answers more often describe specific steps and problems. Speech recognition errors are higher for respondents with strong regional accents, so a coder checks all transcripts against the audio for those cases. Respondents who choose voice are younger on average, so the company compares the topics mentioned by voice and text respondents of similar ages before drawing conclusions. A separate group of 20 respondents records short videos of themselves using the appliance, which the product team finds especially useful for redesign (illustrative example).
Conclusion
Voice and video bring the spoken word and the human face into online surveys. Spoken answers tend to be longer and richer than typed ones, and live video interviews can replace some face-to-face interviewing. But many respondents are reluctant to be recorded, those who agree differ from those who do not, the presence of a voice or face can increase social desirability bias, and recordings raise serious privacy questions. Speech recognition and automated analysis help with scale but bring errors of their own, which may fall unevenly on different groups. Used selectively, with a choice of response method, clear consent and careful checking, voice and video can add depth to survey knowledge without sacrificing its quality.
References
Barrett, L. F., Adolphs, R., Marsella, S., Martinez, A. M., & Pollak, S. D. (2019). Emotional expressions reconsidered: Challenges to inferring emotion from human facial movements. Psychological Science in the Public Interest, 20(1), 1–68. https://doi.org/10.1177/1529100619832930
Chafe, W., & Tannen, D. (1987). The relation between written and spoken language. Annual Review of Anthropology, 16, 383–407. https://doi.org/10.1146/annurev.an.16.100187.002123
Conrad, F. G., Schober, M. F., Hupp, A. L., West, B. T., Larsen, K. M., Ong, A. R., & Wang, T. (2023). Video in survey interviews: Effects on data quality and respondent experience. Methods, Data, Analyses, 17(2), 135–170.
Conrad, F. G., Schober, M. F., Jans, M., Orlowski, R. A., Nielsen, D., & Levenstein, R. (2015). Comprehension and engagement in survey interviews with virtual agents. Frontiers in Psychology, 6, Article 1578. https://doi.org/10.3389/fpsyg.2015.01578
Couper, M. P. (2017). New developments in survey data collection. Annual Review of Sociology, 43, 121–145. https://doi.org/10.1146/annurev-soc-060116-053613
Endres, K., Hillygus, D. S., DeBell, M., & Iyengar, S. (2023). A randomized experiment evaluating survey mode effects for video interviewing. Political Science Research and Methods, 11(1), 144–159.
European Parliament & Council of the European Union. (2016). Regulation (EU) 2016/679 of the European Parliament and of the Council of 27 April 2016 on the protection of natural persons with regard to the processing of personal data and on the free movement of such data (General Data Protection Regulation). Official Journal of the European Union, L 119, 1–88.
Gavras, K., & Höhne, J. K. (2022). Evaluating political parties: Criterion validity of open questions with requests for text and voice answers. International Journal of Social Research Methodology, 25(1), 135–141. https://doi.org/10.1080/13645579.2020.1860279
Gavras, K., Höhne, J. K., Blom, A. G., & Schoen, H. (2022). Innovating the collection of open-ended answers: The linguistic and content characteristics of written and oral answers to political attitude questions. Journal of the Royal Statistical Society: Series A, 185(3), 872–890. https://doi.org/10.1111/rssa.12807
Keusch, F., Struminskaya, B., Antoun, C., Couper, M. P., & Kreuter, F. (2019). Willingness to participate in passive mobile data collection. Public Opinion Quarterly, 83(S1), 210–235. https://doi.org/10.1093/poq/nfz007
Koenecke, A., Nam, A., Lake, E., Nudell, J., Quartey, M., Mengesha, Z., Toups, C., Rickford, J. R., Jurafsky, D., & Goel, S. (2020). Racial disparities in automated speech recognition. Proceedings of the National Academy of Sciences, 117(14), 7684–7689. https://doi.org/10.1073/pnas.1915768117
Kreuter, F., Presser, S., & Tourangeau, R. (2008). Social desirability bias in CATI, IVR, and web surveys: The effects of mode and question sensitivity. Public Opinion Quarterly, 72(5), 847–865. https://doi.org/10.1093/poq/nfn063
Lind, L. H., Schober, M. F., Conrad, F. G., & Reichert, H. (2013). Why do survey respondents disclose more when computers ask the questions? Public Opinion Quarterly, 77(4), 888–935. https://doi.org/10.1093/poq/nft038
Lucas, G. M., Gratch, J., King, A., & Morency, L.-P. (2014). It's only a computer: Virtual humans increase willingness to disclose. Computers in Human Behavior, 37, 94–100. https://doi.org/10.1016/j.chb.2014.04.043
Revilla, M., & Couper, M. P. (2021). Improving the use of voice recording in a smartphone survey. Social Science Computer Review, 39(6), 1159–1178. https://doi.org/10.1177/0894439319888708
Revilla, M., & Ochoa, C. (2016). Open narrative questions in PC and smartphones: Is the device playing a role? Quality & Quantity, 50(6), 2495–2513. https://doi.org/10.1007/s11135-015-0273-2
Revilla, M., Couper, M. P., Bosch, O. J., & Asensio, M. (2020). Testing the use of voice input in a smartphone web survey. Social Science Computer Review, 38(2), 207–224. https://doi.org/10.1177/0894439318810715
Roberts, M. E., Stewart, B. M., Tingley, D., Lucas, C., Leder-Luis, J., Gadarian, S. K., Albertson, B., & Rand, D. G. (2014). Structural topic models for open-ended survey responses. American Journal of Political Science, 58(4), 1064–1082. https://doi.org/10.1111/ajps.12103
Schober, M. F., Conrad, F. G., Antoun, C., Ehlen, P., Fail, S., Hupp, A. L., Johnston, M., Vickers, L., Yan, H. Y., & Zhang, C. (2015). Precision and disclosure in text and voice interviews on smartphones. PLOS ONE, 10(6), Article e0128337. https://doi.org/10.1371/journal.pone.0128337
Schonlau, M., & Couper, M. P. (2016). Semi-automated categorization of open-ended questions. Survey Research Methods, 10(2), 143–152. https://doi.org/10.18148/srm/2016.v10i2.6213
Smyth, J. D., Dillman, D. A., Christian, L. M., & McBride, M. (2009). Open-ended questions in web surveys: Can increasing the size of answer boxes and providing extra verbal instructions improve response quality? Public Opinion Quarterly, 73(2), 325–337. https://doi.org/10.1093/poq/nfp029
Tourangeau, R., & Smith, T. W. (1996). Asking sensitive questions: The impact of data collection mode, question format, and question context. Public Opinion Quarterly, 60(2), 275–304. https://doi.org/10.1086/297751
Tourangeau, R., & Yan, T. (2007). Sensitive questions in surveys. Psychological Bulletin, 133(5), 859–883. https://doi.org/10.1037/0033-2909.133.5.859
Turner, C. F., Ku, L., Rogers, S. M., Lindberg, L. D., Pleck, J. H., & Sonenstein, F. L. (1998). Adolescent sexual behavior, drug use, and violence: Increased reporting with computer survey technology. Science, 280(5365), 867–873. https://doi.org/10.1126/science.280.5365.867
West, B. T., Ong, A. R., Conrad, F. G., Schober, M. F., Larsen, K. M., & Hupp, A. L. (2022). Interviewer effects in live video and prerecorded video self-interviewing. Journal of Survey Statistics and Methodology, 10(2), 317–336.