
Surveys · Incentives and engagement
Survey Fatigue: Causes, Consequences and Prevention
Survey fatigue appears both when people are asked to take part in too many surveys and when a single questionnaire goes on too long. This article explains the causes of fatigue, the evidence on its effects on response and data quality, and practical ways to prevent it.
"Survey fatigue" is one of the most frequently cited explanations for falling response rates and declining data quality. The term is used in two related senses. Over-surveying fatigue arises when people receive so many survey requests that they become less willing to take part in any of them. Within-survey fatigue, or respondent fatigue, arises during a single questionnaire, when the effort of answering leads people to make less effort, skip questions or abandon the survey. Both reduce the quality of the knowledge that surveys produce, and both are largely within the control of survey designers.
This article explains the causes of survey fatigue, reviews the evidence on its consequences and describes how it can be prevented.
Fatigue across surveys
People today are asked for their views constantly. Purchases, deliveries, customer service calls, hospital visits and app updates are followed by requests for ratings or feedback. Employees receive engagement and pulse surveys, students receive course evaluations and citizens receive consultations from public bodies. Each request may be reasonable in isolation, but together they add up to a heavy load.
Evidence on the effects of over-surveying comes mainly from populations that are surveyed frequently. Porter et al. (2004) studied students who received several surveys during the same academic year and found that response to later surveys was lower among students who had been asked to complete earlier ones, particularly when surveys arrived close together. Long-term trends in response rates in many countries are consistent with growing reluctance to take part in surveys, although many factors contribute to the decline (Groves & Couper, 1998; Stoop et al., 2010). Surveys about surveys show that public attitudes towards survey research have changed over time and that people who feel surveys are too frequent or too long are less willing to take part (Kim et al., 2011).
Over-surveying also affects online panels. Panel members who are invited to many surveys may become less attentive, and some become professional respondents who take very large numbers of surveys, mainly for the rewards (Hillygus et al., 2014). Members who are invited too often may leave the panel altogether.
Fatigue within a survey
Within a questionnaire, fatigue arises from the cumulative effort of reading, understanding and answering questions. Satisficing theory explains how this affects answers: when motivation falls or the task becomes harder, respondents shift from careful answering to shortcuts that produce acceptable but less accurate answers (Krosnick, 1991). Typical shortcuts include choosing the same answer for every item in a grid, agreeing with statements regardless of content, selecting "don't know" and giving minimal answers to open questions.
Research has shown these effects for decades. Herzog and Bachman (1981) found that respondents to a long questionnaire were more likely to give identical answers to a series of items placed near the end than to similar items placed earlier. Galesic and Bosnjak (2009) randomly varied the announced and actual length of a web survey and found that questions placed later in the questionnaire received faster, shorter and less differentiated answers. Figure 1 illustrates the typical pattern.
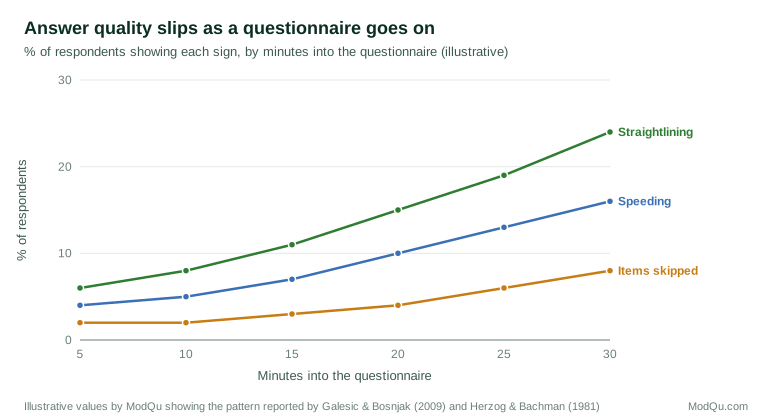
Fatigue also leads to breakoff, where respondents abandon a questionnaire before finishing. Galesic (2006) found that respondents' interest declined and their sense of burden rose as a web survey progressed, and that these changes predicted breakoff. Peytchev (2009) found that breakoffs in web surveys clustered at questions that demanded more effort, such as grids and open questions, and increased as the questionnaire went on.
How long is too long?
There is no single limit, because tolerance depends on the topic, the respondent, the mode and any incentive. Some evidence is available, however. Revilla and Ochoa (2017) asked members of online panels about ideal and maximum lengths for web surveys; the median ideal length was around ten minutes and the median maximum around twenty. Rolstad et al. (2011), in a meta-analysis of studies in health research, found that longer questionnaires were associated with lower response rates, though they cautioned that content mattered as well as length. Deutskens et al. (2004) found in an online experiment that a shorter questionnaire produced a higher response rate.
Length is only one part of burden. Bradburn (1978) described respondent burden as depending on the length of the interview, the effort required, the stress caused by the questions and the frequency of being interviewed. Sharp and Frankel (1983) found that perceived burden was related more to respondents' views of the survey's value and the effort required than to its actual length. A long questionnaire on a topic that respondents care about may feel less burdensome than a short one that seems pointless.
Causes of fatigue
Figure 2 summarises six common causes.
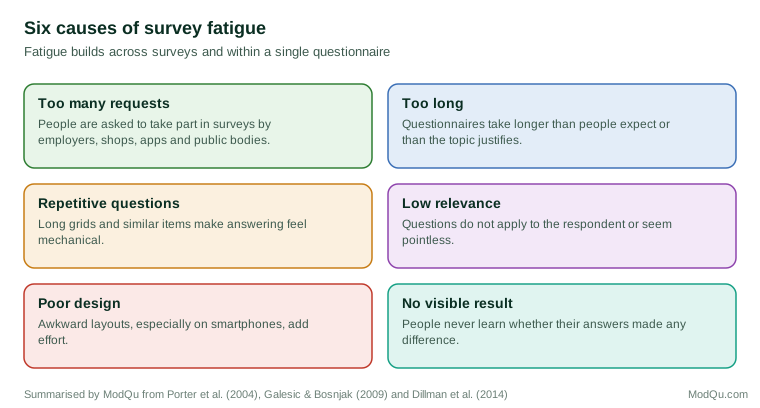
Repetitive formats are a major cause. Long grids of items with the same response scale are efficient to design but tiring to answer. Respondents tend to straightline them, especially on smartphones (Schonlau & Toepoel, 2015). Roßmann et al. (2018) found that interventions such as prompting respondents who straightlined could reduce satisficing in demanding grids.
Low relevance also matters. Questions that do not apply to the respondent, or that seem to have no purpose, reduce motivation. Good routing, which skips questions that do not apply, reduces both burden and fatigue.
Design and device affect effort. Questionnaires designed for a computer screen can be hard to complete on a smartphone, where grids require scrolling and small buttons are easy to miss. Toepoel et al. (2009) found that the number of items placed on each screen affected answers and completion time in web surveys.
Measuring burden
Burden can be measured objectively and subjectively. Objective burden is usually measured as the time taken to complete the questionnaire, which survey software records automatically, together with the number of questions and the number of times a person is contacted. Perceived burden is how demanding the respondent feels the survey to be, measured by asking at the end how long, difficult, interesting or intrusive it seemed. The two are related but not the same. Sharp and Frankel (1983) found that respondents' sense of burden depended more on whether they saw the survey as worthwhile and on how much effort particular questions required than on the length of the interview itself. Bradburn (1978) argued that burden reflects the frequency of requests and the stress of answering as well as time.
The distinction matters for prevention. Cutting minutes from a questionnaire reduces objective burden, but making the purpose clear, removing irrelevant questions and simplifying difficult ones may do more to reduce perceived burden. Official statistical agencies often report the total time that businesses and households spend on their surveys and set targets to reduce it.
Mobile respondents
A growing share of web questionnaires is answered on smartphones, and fatigue sets in sooner on small screens. Each question requires more scrolling, typing is slower and respondents are more often interrupted by their surroundings. Mavletova (2013) found that respondents using mobile devices took longer to complete a web survey and broke off more often than those using computers. Long grids are especially tiring on a phone and often display as long lists that must be scrolled repeatedly. Questionnaires that are acceptable on a computer may therefore be too long for mobile respondents, and length targets should be set with the smallest screen in mind.
Consequences for knowledge
Survey fatigue affects the knowledge that surveys produce in several ways.
Lower response. People who are tired of surveys decline more often, reducing response rates and potentially increasing nonresponse bias if those who decline differ from those who take part.
Selective participation. If over-surveying makes busy or less interested people decline, the remaining respondents may be those with more time or stronger opinions. Satisfaction surveys can become dominated by people who are very pleased or very unhappy.
Lower data quality. Straightlining, speeding, item nonresponse and shorter open answers reduce the accuracy of measurement (Zhang & Conrad, 2014). Fatigue effects concentrated at the end of a questionnaire mean that questions placed late are measured less well than those placed early.
Order effects. Because quality declines over the course of a questionnaire, the placement of questions affects results. Comparisons between questions placed early and late, or between surveys that place the same question differently, may reflect fatigue rather than real differences.
Biased estimates in experiments. In studies with repeated tasks, such as choice experiments, fatigue can change how respondents behave in later tasks. Savage and Waldman (2008) found evidence of both learning and fatigue across a sequence of choice tasks.
Prevention: reducing the number of surveys
Organisations can reduce fatigue across surveys by coordinating their requests:
- Keep a register of surveys sent to customers, employees or members, and limit how often each person is asked.
- Combine surveys that cover related topics into one.
- Use samples rather than surveying everyone. A well-designed sample of 1,000 customers often gives more reliable results than a census with a low response.
- Use existing data where possible, such as administrative records or transaction data, rather than asking questions whose answers are already known.
- Close the loop by telling respondents what was learned and what changed as a result.
Panel companies limit the number of invitations sent to each member and the number of surveys each member can complete in a period (Callegaro et al., 2014).
Prevention: designing shorter, easier questionnaires
Within a survey, the most effective remedy is a shorter questionnaire. Every question should be justified by a clear use for its answer. Questions included "because they might be interesting" add burden without adding knowledge.
Other design practices also help:
- Put the most important questions early, where answers are most careful.
- Break up long grids into shorter sets or item-by-item questions, especially for smartphone respondents (Revilla & Couper, 2018).
- Vary the format so that answering does not become mechanical.
- Use routing to skip questions that do not apply.
- Give an honest estimate of length at the start; underestimates increase breakoffs (Crawford et al., 2001).
- Show progress in ways that encourage, though progress indicators should be tested since they can backfire (Villar et al., 2013).
- Design for smartphones from the start.
- Use modular designs, in which each respondent answers only a subset of questions, with the full set covered across the sample.
Fatigue in interviewer surveys
Interviewers can slow the onset of fatigue. A skilled interviewer sets a steady pace, recognises when a respondent is tiring, offers a short break and keeps the conversation engaging. Interviewers also prevent some shortcuts that self-completion allows, such as skipping questions without comment. But interviewers are affected by fatigue too: after many interviews, they may read questions faster or abbreviate them, which reduces the time respondents have to think. Long interviews also increase the chance that a respondent ends the interview early or declines a follow-up. In panel surveys with face-to-face interviews, interview length is a known influence on willingness to take part in later waves (Groves & Couper, 1998).
Modular and split questionnaire designs
When a survey must cover more topics than any respondent can reasonably answer, split questionnaire designs offer a solution. The questionnaire is divided into a core module, asked of everyone, and several further modules, each asked of a random subset of respondents. Every respondent answers a shorter questionnaire, while the sample as a whole covers all topics. Statistical methods, such as multiple imputation, can then be used to estimate relationships between variables in different modules (Raghunathan & Grizzle, 1995). The cost is lower precision for questions asked of fewer people and more complex analysis, but the gain in data quality from shorter questionnaires is often worth it.
Fatigue in business surveys
Businesses face a particular form of over-surveying. Statistical agencies, regulators, industry associations and market researchers all ask businesses for information, and the same staff often handle all of these requests. Small businesses, which have few staff, carry the heaviest burden relative to their size. Many statistical agencies therefore coordinate their samples so that small businesses are not selected for several surveys at once, rotate businesses out of samples after a period and use administrative data, such as tax records, in place of survey questions wherever possible. Clear explanations of why information is needed and how it will be used also help, as does allowing respondents to save and return to online forms (Dillman et al., 2014).
Incentives and motivation
Incentives can increase willingness to take part and may sustain effort within the questionnaire. Evidence suggests that incentives generally do not reduce data quality and sometimes improve it (Singer & Ye, 2013). However, incentives cannot compensate for a questionnaire that is too long or poorly designed. Explaining the purpose of the survey and how results will be used gives respondents a reason to make an effort, which matters as much as any payment (Dillman et al., 2014).
Testing for fatigue before fieldwork
Fatigue is easier to prevent than to correct. Pretesting should include timing the questionnaire with real respondents, on the devices they will use, rather than relying on the designer's estimate. Respondents in pretests can be asked which parts felt long, repetitive or irrelevant. In pilot studies, paradata show where respondents slow down, speed up or break off, and comparing answers to the same type of question early and late in the questionnaire shows whether quality declines. If the pilot shows that a section is consistently answered poorly, it should be shortened, moved earlier or removed.
Respecting respondents' time
Preventing fatigue is also an ethical matter. Respondents give their time voluntarily, usually without significant payment, and researchers have a responsibility not to waste it. Professional codes require researchers to be honest about the length of surveys and to minimise burden. Asking questions whose answers will never be analysed, or surveying people far more often than the information requires, treats that time as free. Treating respondents' time as a scarce resource leads to better surveys and preserves the public's willingness to take part in future ones.
Detecting fatigue in the data
Researchers can check for fatigue in their data using paradata and quality indicators. Response times per page, straightlining rates for each grid, item nonresponse by position in the questionnaire and breakoff points all reveal where fatigue sets in. Comparing these indicators between early and late sections shows how much quality declines. Where possible, rotating the order of sections across respondents allows fatigue effects to be measured directly and prevents them from always falling on the same questions.
Fatigue in longitudinal and panel surveys
Panels that interview the same people repeatedly face a distinctive form of fatigue. Each wave adds to members' cumulative burden, and members who find earlier interviews long or repetitive are more likely to drop out later. Repeated exposure to the same questions can also change answers, a process known as panel conditioning: some members learn that answering "no" to a filter question avoids follow-up questions and use this shortcut in later waves. Schonlau and Toepoel (2015) found that straightlining in a long-running web panel increased over time among some members. Keeping questionnaires short at each wave, varying content between waves and monitoring indicators of effort across waves help limit these effects.
Fatigue in employee and customer surveys
Organisations that survey their own employees or customers are especially exposed to over-surveying, because they control the frequency of requests and often add surveys without coordination. Employees may receive an annual engagement survey, several pulse surveys, training evaluations and requests from different departments in the same month. Customers may be asked for feedback after every interaction. When people see no result from earlier surveys, they conclude that their answers do not matter. Coordinating requests across departments, setting a maximum frequency for each person and reporting back on actions taken are the most effective remedies. Smaller, well-designed samples often give better information than repeated surveys of everyone.
An example
A university surveys its students on teaching quality, library services, accommodation, careers advice and wellbeing, each through a separate questionnaire sent at different times. Response has fallen below 15 per cent for most of them. The university creates a single annual student survey with a core module answered by everyone and rotating modules answered by random subsets of students, limits other surveys to small samples and publishes a short "you said, we did" summary each term. Response to the annual survey reaches 32 per cent, and straightlining in the core module falls by a third compared with the previous separate surveys (illustrative example).
Conclusion
Survey fatigue reduces both the number of people willing to take part in surveys and the care with which they answer. It arises from too many requests, questionnaires that are too long or repetitive, questions of low relevance and designs that make answering harder than it needs to be. Its consequences include lower response, selective participation, poorer data and order effects that distort comparisons. Most of its causes are under the control of the organisations that conduct surveys. Coordinating requests, asking only questions that will be used, designing for ease and showing respondents that their answers matter all help to preserve the willingness of the public to contribute to survey knowledge.
References
Bradburn, N. M. (1978). Respondent burden. In Proceedings of the Survey Research Methods Section, American Statistical Association (pp. 35–40). American Statistical Association.
Callegaro, M., Baker, R., Bethlehem, J., Göritz, A. S., Krosnick, J. A., & Lavrakas, P. J. (Eds.). (2014). Online panel research: A data quality perspective. Wiley. https://doi.org/10.1002/9781118763520
Crawford, S. D., Couper, M. P., & Lamias, M. J. (2001). Web surveys: Perceptions of burden. Social Science Computer Review, 19(2), 146–162. https://doi.org/10.1177/089443930101900202
Deutskens, E., de Ruyter, K., Wetzels, M., & Oosterveld, P. (2004). Response rate and response quality of internet-based surveys: An experimental study. Marketing Letters, 15(1), 21–36. https://doi.org/10.1023/B:MARK.0000021968.86465.00
Dillman, D. A., Smyth, J. D., & Christian, L. M. (2014). Internet, phone, mail, and mixed-mode surveys: The tailored design method (4th ed.). Wiley.
Galesic, M., & Bosnjak, M. (2009). Effects of questionnaire length on participation and indicators of response quality in a web survey. Public Opinion Quarterly, 73(2), 349–360. https://doi.org/10.1093/poq/nfp031
Galesic, M. (2006). Dropouts on the web: Effects of interest and burden experienced during an online survey. Journal of Official Statistics, 22(2), 313–328.
Groves, R. M., & Couper, M. P. (1998). Nonresponse in household interview surveys. Wiley. https://doi.org/10.1002/9781118490082
Herzog, A. R., & Bachman, J. G. (1981). Effects of questionnaire length on response quality. Public Opinion Quarterly, 45(4), 549–559. https://doi.org/10.1086/268687
Hillygus, D. S., Jackson, N., & Young, M. (2014). Professional respondents in nonprobability online panels. In M. Callegaro, R. Baker, J. Bethlehem, A. S. Göritz, J. A. Krosnick, & P. J. Lavrakas (Eds.), Online panel research: A data quality perspective (pp. 219–237). Wiley. https://doi.org/10.1002/9781118763520.ch10
Kim, J., Gershenson, C., Glaser, P., & Smith, T. W. (2011). The polls—trends: Trends in surveys on surveys. Public Opinion Quarterly, 75(1), 165–191. https://doi.org/10.1093/poq/nfq047
Krosnick, J. A. (1991). Response strategies for coping with the cognitive demands of attitude measures in surveys. Applied Cognitive Psychology, 5(3), 213–236. https://doi.org/10.1002/acp.2350050305
Mavletova, A. (2013). Data quality in PC and mobile web surveys. Social Science Computer Review, 31(6), 725–743. https://doi.org/10.1177/0894439313485201
Peytchev, A. (2009). Survey breakoff. Public Opinion Quarterly, 73(1), 74–97. https://doi.org/10.1093/poq/nfp014
Porter, S. R., Whitcomb, M. E., & Weitzer, W. H. (2004). Multiple surveys of students and survey fatigue. New Directions for Institutional Research, 2004(121), 63–73. https://doi.org/10.1002/ir.101
Raghunathan, T. E., & Grizzle, J. E. (1995). A split questionnaire survey design. Journal of the American Statistical Association, 90(429), 54–63. https://doi.org/10.1080/01621459.1995.10476488
Revilla, M., & Couper, M. P. (2018). Comparing grids with vertical and horizontal item-by-item formats for PCs and smartphones. Social Science Computer Review, 36(3), 349–368. https://doi.org/10.1177/0894439317715626
Revilla, M., & Ochoa, C. (2017). Ideal and maximum length for a web survey. International Journal of Market Research, 59(5), 557–565. https://doi.org/10.2501/IJMR-2017-039
Rolstad, S., Adler, J., & Rydén, A. (2011). Response burden and questionnaire length: Is shorter better? A review and meta-analysis. Value in Health, 14(8), 1101–1108. https://doi.org/10.1016/j.jval.2011.06.003
Roßmann, J., Gummer, T., & Silber, H. (2018). Mitigating satisficing in cognitively demanding grid questions: Evidence from two web-based experiments. Journal of Survey Statistics and Methodology, 6(3), 376–400. https://doi.org/10.1093/jssam/smx020
Savage, S. J., & Waldman, D. M. (2008). Learning and fatigue during choice experiments: A comparison of online and mail survey modes. Journal of Applied Econometrics, 23(3), 351–371. https://doi.org/10.1002/jae.984
Schonlau, M., & Toepoel, V. (2015). Straightlining in web survey panels over time. Survey Research Methods, 9(2), 125–137. https://doi.org/10.18148/srm/2015.v9i2.6128
Sharp, L. M., & Frankel, J. (1983). Respondent burden: A test of some common assumptions. Public Opinion Quarterly, 47(1), 36–53. https://doi.org/10.1086/268765
Singer, E., & Ye, C. (2013). The use and effects of incentives in surveys. The Annals of the American Academy of Political and Social Science, 645(1), 112–141. https://doi.org/10.1177/0002716212458082
Stoop, I., Billiet, J., Koch, A., & Fitzgerald, R. (2010). Improving survey response: Lessons learned from the European Social Survey. Wiley. https://doi.org/10.1002/9780470688335
Toepoel, V., Das, M., & van Soest, A. (2009). Design of web questionnaires: The effects of the number of items per screen. Field Methods, 21(2), 200–213. https://doi.org/10.1177/1525822X08330261
Villar, A., Callegaro, M., & Yang, Y. (2013). Where am I? A meta-analysis of experiments on the effects of progress indicators for web surveys. Social Science Computer Review, 31(6), 744–762. https://doi.org/10.1177/0894439313497468
Zhang, C., & Conrad, F. G. (2014). Speeding in web surveys: The tendency to answer very fast and its association with straightlining. Survey Research Methods, 8(2), 127–135. https://doi.org/10.18148/srm/2014.v8i2.5453