
Surveys · Nonresponse, weighting and data quality
Speeders, Straightliners and Bots: Cleaning Online Survey Data
Online survey data often contain answers from people who rushed, gave the same answer to everything or were not people at all. This article explains how to detect speeders, straightliners and bots, how to decide what to remove and how to report data cleaning honestly.
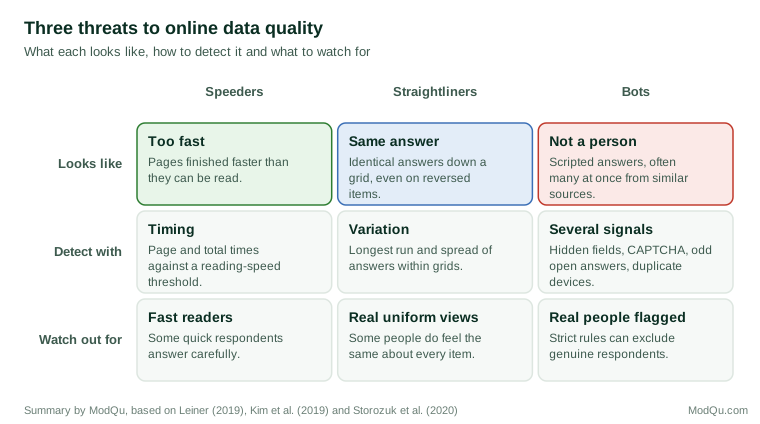
Online surveys make data collection fast and cheap, but they also make it easy to give poor answers. Some respondents rush through without reading. Some give the same answer to every item in a list. Some responses come from automated programs rather than people. Each of these threatens the accuracy of the knowledge a survey produces, and each requires a different approach to detection (Leiner, 2019; Ward & Meade, 2023). This article describes the three main threats and sets out a practical process for cleaning online survey data. Figure 1 summarises the three threats.
Speeders
Speeders complete the survey, or parts of it, faster than is possible if the questions are read. Zhang and Conrad (2014) found that speeding was associated with straightlining, suggesting that both reflect low effort. Malhotra (2008) found that respondents who completed a web survey quickly showed stronger response order effects, choosing options near the top of lists more often.
Detecting speeders requires timing data. Total completion time is easy to record, but page-level times are more informative, because a respondent may answer carefully at first and rush later. Common rules flag respondents whose time falls below a fraction of the median, such as 30 or 40 per cent, or below an estimated reading time based on the number of words (Greszki et al., 2015; Leiner, 2019). Some fast respondents are simply quick readers who answer carefully, so time alone should rarely be the sole reason for exclusion. Greszki et al. (2015) found that removing very fast respondents had only small effects on most estimates but did change some results, and that speeders differed from other respondents in age and education.
Straightliners
Straightliners give identical or nearly identical answers to a set of items that share a response scale, typically in a grid. Some straightlining reflects genuine views: a satisfied customer may rate every aspect of a service as good. When a grid includes items worded in opposite directions, however, identical answers are inconsistent and suggest that the items were not read (Kim et al., 2019).
Measures of straightlining include the longest run of identical answers, the proportion of items given the most common answer and the standard deviation of answers within a grid. Kim et al. (2019) compared several such indicators and found that they identified different respondents, so the choice of measure affects who is flagged. Straightlining increases with the length of grids and with their position later in a questionnaire (Herzog & Bachman, 1981).
Bots and fraudulent respondents
Bots are automated programs that complete surveys, usually to collect incentives. Fraudulent human respondents may also complete a survey many times or misrepresent themselves to qualify. Open survey links shared on social media or public websites are particularly vulnerable. Pozzar et al. (2020) reported that a large majority of responses to a survey advertised on social media were judged to come from bots or other bad actors. Similar problems have affected online labour platforms used for research (Chmielewski & Kucker, 2020; Kennedy et al., 2020).
Signs of bots and fraud include (Storozuk et al., 2020; Griffin et al., 2022):
- many responses arriving in a short time, often at unusual hours;
- identical or near-identical answers across responses, including open-ended text;
- open answers that are irrelevant, copied from elsewhere or grammatically odd;
- duplicate or suspicious internet addresses, devices or locations inconsistent with eligibility;
- answers to hidden fields that real respondents cannot see, which only automated programs fill in; and
- failure of CAPTCHA or other challenges designed to distinguish people from programs.
No single sign is conclusive. Several people in one household may share an internet address, and some genuine respondents write short or unusual open answers. Combining signals, and reviewing borderline cases, reduces errors (Teitcher et al., 2015).
Other signs of poor quality
Speed, straightlining and bot signals are not the only indicators. Leiner (2019) described a third group of "weird" answer patterns: combinations of answers that are implausible, such as a 19-year-old reporting 30 years in the same job, or a respondent who claims to use every product in a long list. Open-ended answers offer another check. Genuine respondents write answers that relate to the question, even if briefly; meaningless strings, copied text and repeated phrases across respondents suggest a problem. Consistency between related questions, such as an age given at the start and a year of birth given later, can also reveal careless or fraudulent responding (Meade & Craig, 2012). These checks are especially useful because they are hard for automated programs to pass and do not depend on timing data, which some survey platforms do not record well.
Open links and managed panels
The balance of threats depends on how respondents were recruited. Surveys with open links, posted on social media or public websites, are most exposed to bots and repeat entries, because anyone can follow the link as often as they like. Surveys sent to named people with unique links are largely protected from bots but still see speeding and straightlining. Commercial panels sit between the two: panel providers screen members and remove known fraudsters, but professional respondents who take many surveys may become skilled at passing checks while answering with little care (Chmielewski & Kucker, 2020). Cleaning rules should therefore be set with the recruitment method in mind, with heavier bot defences for open links and closer attention to effort indicators in panels.
A cleaning process
Cleaning works best as a planned process rather than a series of judgements made after seeing the data. Figure 2 sets out five steps.
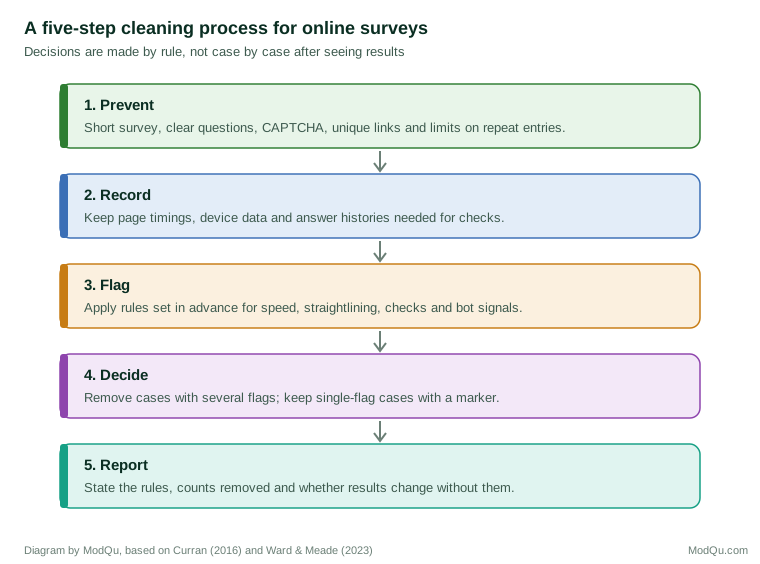
Prevent. Many problems can be reduced at the design stage. Short questionnaires and fewer large grids reduce speeding and straightlining. Unique survey links, CAPTCHA, limits on repeat participation from the same device and screening questions that do not reveal the eligibility rules reduce fraud (Storozuk et al., 2020).
Record. Collect the paradata needed for checks: page timings, device type, start and end times and answer histories.
Flag. Apply rules set before the data are examined, for speed, straightlining, failed attention checks, inconsistent answers and bot signals (Curran, 2016).
Decide. Remove cases that meet several rules or that are clearly not genuine. Keep cases with a single flag but mark them, so that results can be checked with and without them (Meade & Craig, 2012).
Report. Describe the rules, the number of cases flagged and removed under each and whether key results change when flagged cases are excluded (Ward & Meade, 2023).
The risk of over-cleaning
Data cleaning can introduce bias of its own. Respondents flagged as speeders or straightliners are more often young, male or less educated, so removing them can make the sample less representative (Greszki et al., 2015). Strict rules may also remove genuine respondents with unusual but honest answers. And deciding exclusions after seeing which ones produce the desired results is a form of selective reporting. Setting rules in advance, using multiple indicators and showing results both ways guard against these risks (Curran, 2016; Ward & Meade, 2023).
An example
An online survey with an open link receives 4,800 completed questionnaires in a week, far more than expected. Checks show that 1,900 arrived within six hours on one night, many with identical open-ended answers, and 1,600 of those also completed a hidden field. These are removed as bot responses. Among the remaining 2,900, the team applies rules set in advance: 110 respondents completed the survey in less than a third of the median time and also straightlined the main grid, and are removed; 240 met one rule only and are kept with a flag. Results with and without the flagged group differ by no more than two percentage points. The team reports each step and closes the open link, switching to unique invitations for the next wave (illustrative example).
Conclusion
Speeders, straightliners and bots are distinct threats to online survey data. Speeders rush, straightliners give uniform answers and bots are not respondents at all. Each can be detected using paradata and answer patterns, but no indicator is perfect, and over-zealous cleaning can bias results. Preventing problems through design, recording the right data, applying rules set in advance and reporting cleaning decisions openly allow researchers to remove poor-quality data while keeping the sample representative.
References
Chmielewski, M., & Kucker, S. C. (2020). An MTurk crisis? Shifts in data quality and the impact on study results. Social Psychological and Personality Science, 11(4), 464–473. https://doi.org/10.1177/1948550619875149
Curran, P. G. (2016). Methods for the detection of carelessly invalid responses in survey data. Journal of Experimental Social Psychology, 66, 4–19. https://doi.org/10.1016/j.jesp.2015.07.006
Greszki, R., Meyer, M., & Schoen, H. (2015). Exploring the effects of removing "too fast" responses and respondents from web surveys. Public Opinion Quarterly, 79(2), 471–503. https://doi.org/10.1093/poq/nfu058
Griffin, M., Martino, R. J., LoSchiavo, C., Comer-Carruthers, C., Krause, K. D., Stults, C. B., & Halkitis, P. N. (2022). Ensuring survey research data integrity in the era of internet bots. Quality & Quantity, 56, 2841–2852. https://doi.org/10.1007/s11135-021-01252-1
Herzog, A. R., & Bachman, J. G. (1981). Effects of questionnaire length on response quality. Public Opinion Quarterly, 45(4), 549–559. https://doi.org/10.1086/268687
Kennedy, R., Clifford, S., Burleigh, T., Waggoner, P. D., Jewell, R., & Winter, N. J. G. (2020). The shape of and solutions to the MTurk quality crisis. Political Science Research and Methods, 8(4), 614–629. https://doi.org/10.1017/psrm.2020.6
Kim, Y., Dykema, J., Stevenson, J., Black, P., & Moberg, D. P. (2019). Straightlining: Overview of measurement, comparison of indicators, and effects in mail–web mixed-mode surveys. Social Science Computer Review, 37(2), 214–233. https://doi.org/10.1177/0894439317752406
Leiner, D. J. (2019). Too fast, too straight, too weird: Non-reactive indicators for meaningless data in internet surveys. Survey Research Methods, 13(3), 229–248. https://doi.org/10.18148/srm/2019.v13i3.7403
Malhotra, N. (2008). Completion time and response order effects in web surveys. Public Opinion Quarterly, 72(5), 914–934. https://doi.org/10.1093/poq/nfn050
Meade, A. W., & Craig, S. B. (2012). Identifying careless responses in survey data. Psychological Methods, 17(3), 437–455. https://doi.org/10.1037/a0028085
Pozzar, R., Hammer, M. J., Underhill-Blazey, M., Wright, A. A., Tulsky, J. A., Hong, F., Gundersen, D. A., & Berry, D. L. (2020). Threats of bots and other bad actors to data quality following research participant recruitment through social media: Cross-sectional questionnaire. Journal of Medical Internet Research, 22(10), e23021. https://doi.org/10.2196/23021
Storozuk, A., Ashley, M., Delage, V., & Maloney, E. A. (2020). Got bots? Practical recommendations to protect online survey data from bot attacks. The Quantitative Methods for Psychology, 16(5), 472–481. https://doi.org/10.20982/tqmp.16.5.p472
Teitcher, J. E. F., Bockting, W. O., Bauermeister, J. A., Hoefer, C. J., Miner, M. H., & Klitzman, R. L. (2015). Detecting, preventing, and responding to "fraudsters" in internet research: Ethics and tradeoffs. Journal of Law, Medicine & Ethics, 43(1), 116–133. https://doi.org/10.1111/jlme.12200
Ward, M. K., & Meade, A. W. (2023). Dealing with careless responding in survey data: Prevention, identification, and recommended best practices. Annual Review of Psychology, 74, 577–596. https://doi.org/10.1146/annurev-psych-040422-045007
Zhang, C., & Conrad, F. G. (2014). Speeding in web surveys: The tendency to answer very fast and its association with straightlining. Survey Research Methods, 8(2), 127–135. https://doi.org/10.18148/srm/2014.v8i2.5453