
Surveys · Nonresponse, weighting and data quality
Social Desirability Bias and Techniques for Reducing It
People tend to present themselves favourably when answering survey questions, over-reporting approved behaviour and under-reporting disapproved behaviour. This article explains social desirability bias, the evidence for it, the conditions that increase it and the techniques that reduce it.
Survey respondents are not neutral reporters of their own lives. When a question touches on behaviour or attitudes that society approves or disapproves of, many people shade their answers towards what they think they should say. They report voting when they did not, giving more to charity than they did and exercising more than they do. They report drinking, smoking and illegal behaviour less than they engage in them. This tendency is called social desirability bias, and it is one of the best-documented sources of error in survey research (Tourangeau & Yan, 2007; Krumpal, 2013).
Social desirability bias matters because it is systematic. Random errors tend to cancel out across respondents; social desirability pushes answers in a predictable direction, so estimates are biased even in large samples. It can also distort comparisons between groups if some groups feel more pressure than others to give approved answers. This article explains what social desirability bias is, reviews the evidence, describes the conditions that make it worse and sets out the main techniques for reducing it.
What social desirability bias is
Social desirability bias arises when respondents edit their answers before reporting them, so that the answers present them in a better light. Tourangeau and Yan (2007) described three kinds of sensitivity that can trigger this editing: questions that are intrusive, touching on private matters such as income or sexual behaviour; questions that carry a threat of disclosure, where answers could have consequences if others learned of them; and questions with socially desirable answers, where one answer conforms to social norms and another does not.
Psychologists have long distinguished two components of socially desirable responding. Paulhus (1984) separated self-deception, an honest but inflated view of oneself, from impression management, a deliberate effort to appear favourable to others. The distinction matters for survey design: impression management responds to changes in privacy and the presence of others, while self-deception is harder to change because the respondent believes the favourable answer.
Evidence of social desirability bias
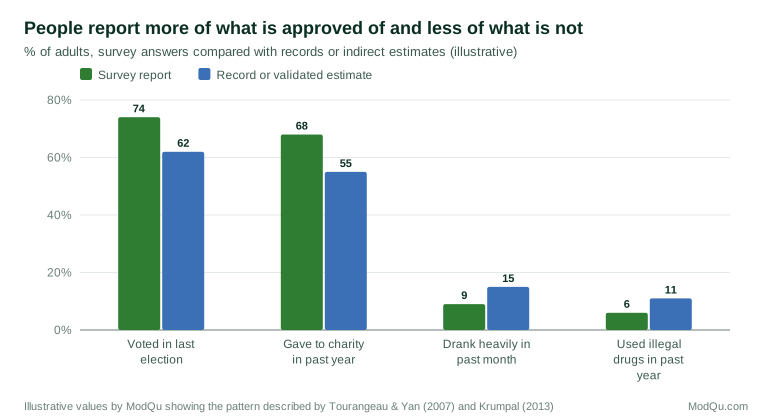
The clearest evidence comes from comparing survey answers with records. In studies of voting, survey estimates of turnout routinely exceed official turnout figures. Validation studies that check individual respondents against voting records have found that a substantial share of non-voters report having voted, and that over-reporting is more common among people for whom voting is a stronger social norm, such as the more educated (Silver et al., 1986; Bernstein et al., 2001). Similar gaps have been found for other behaviours. Figure 1 illustrates the general pattern.
Experiments provide further evidence. When the same questions are asked in different conditions, such as with and without an interviewer, answers to sensitive questions change in the direction predicted by social desirability. Tourangeau and Smith (1996) found that respondents reported more sexual partners and more drug use when they answered by computer-assisted self-interviewing than when an interviewer asked the questions. Kreuter et al. (2008) compared telephone interviewing, interactive voice response and web surveys and found that the web produced the most reports of undesirable characteristics and the fewest reports of desirable ones, and that the differences were largest for the most sensitive items, which could be checked against university records.
When the bias is strongest
Several factors increase social desirability bias (Tourangeau & Yan, 2007; Krumpal, 2013).
The presence of others. An interviewer, a family member or anyone else who might hear the answers increases the pressure to give approved answers. Interviewer-administered modes generally show more bias than self-administered modes (Richman et al., 1999; Kreuter et al., 2008).
The sensitivity of the topic. The bias is largest for behaviours with strong social norms, such as voting, drug use, sexual behaviour, prejudice and illegal acts.
Concerns about confidentiality. When respondents doubt that their answers will be kept private, they are more likely to edit them. Clear assurances of confidentiality can help, though elaborate assurances on non-sensitive topics can make people suspicious (Singer et al., 1995).
Characteristics of the respondent. Some people are more concerned with how they appear than others. Scales such as the Marlowe–Crowne Social Desirability Scale measure this tendency (Crowne & Marlowe, 1960). Cultural norms about self-presentation also vary between countries and groups (Johnson et al., 2005).
Features of the interviewer. Respondents may adjust answers depending on the interviewer's characteristics. Studies of racial attitudes, for example, have found that answers can differ depending on the perceived race of the interviewer.
Techniques for reducing it
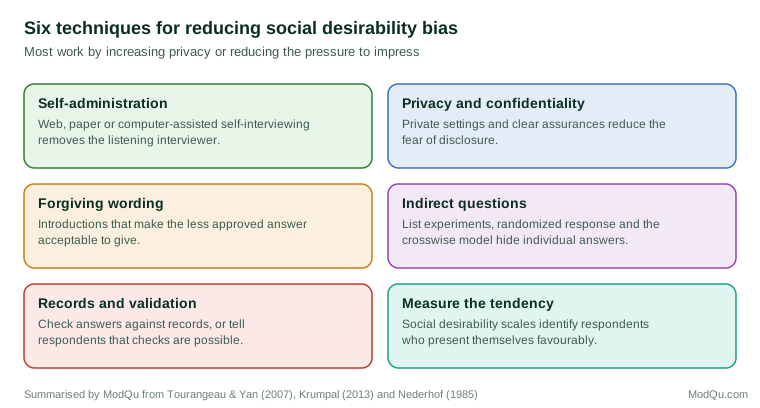
Figure 2 summarises six broad techniques.
Self-administration
The most consistently effective technique is to let respondents answer without an interviewer. Web and paper questionnaires, and computer-assisted self-interviewing during face-to-face surveys, in which the respondent enters sensitive answers directly into a device, produce more reports of undesirable behaviour than interviewer-administered questions (Tourangeau & Smith, 1996; Richman et al., 1999; Kreuter et al., 2008). Where interviews are necessary, sensitive sections can be self-administered, with the interviewer handing over the device or a sealed paper form.
Privacy and confidentiality
Conducting interviews where others cannot hear, and explaining clearly how answers will be protected, reduces fear of disclosure. Confidentiality assurances have modest effects on response, which are larger for sensitive topics (Singer et al., 1995).
Question wording
Wording can make less desirable answers easier to give. Common approaches include (Sudman & Bradburn, 1982; Bradburn et al., 2004):
- Forgiving introductions that present the undesirable answer as common or understandable: "Many people were not able to vote in the last election because they were busy or ill. How about you?"
- Face-saving response options, such as "I usually vote, but did not this time", which give over-reporters an alternative to a false "yes".
- Assuming the behaviour, by asking "How often do you…?" rather than "Do you ever…?", which signals that the behaviour is normal.
- Long, open questions about frequency, which tend to produce higher reports of behaviours such as drinking than short closed questions.
Experiments with face-saving options in voting questions have found that they reduce over-reporting, though not completely (Belli et al., 1999).
Indirect questioning techniques
Indirect techniques are designed so that no one, including the researcher, can tell how an individual answered the sensitive question, while still allowing estimates for the group.
Randomized response uses a random device, such as a coin or dice roll known only to the respondent, to decide whether they answer the sensitive question or a neutral one. Because the probabilities are known, the researcher can estimate the share giving the sensitive answer. Warner (1965) proposed the first design. A meta-analysis found that randomized response generally produced more valid estimates than direct questions, though results varied (Lensvelt-Mulders et al., 2005). Blair et al. (2015) developed modern methods for designing and analysing such studies.
The crosswise model asks respondents whether their answers to two questions, one sensitive and one with a known distribution such as whether their mother's birthday is in the first quarter of the year, are the same or different. This is simpler for respondents than classic randomized response. Höglinger et al. (2016) compared several implementations in online surveys and found that the crosswise model produced higher estimates of undesirable behaviour than direct questions, although some of the increase may reflect random answering.
The list experiment, or item count technique, randomly divides respondents into two groups. One group sees a list of non-sensitive items and reports how many apply to them. The other sees the same list plus the sensitive item. The difference in average counts estimates the share for whom the sensitive item applies (Glynn, 2013; Blair & Imai, 2012). Holbrook and Krosnick (2010) used list experiments to show that direct questions over-reported voter turnout.
Indirect techniques have costs. They require larger samples, because the added randomness reduces precision, and some respondents find them confusing or distrust them. They produce estimates for groups rather than individuals, which limits analysis (Krumpal, 2013).
Validation and the bogus pipeline
Telling respondents that their answers can be checked against records, or collecting biological samples that could verify reports of smoking or drug use, can increase honest reporting. This bogus pipeline effect has been observed in studies where respondents believed their answers could be verified, even when they could not (Tourangeau & Yan, 2007). Ethical considerations limit the use of deception, but genuine validation can be used where records exist.
Measuring the tendency
Including a short social desirability scale allows researchers to identify respondents who present themselves very favourably and to check whether results change when this tendency is taken into account (Crowne & Marlowe, 1960; Paulhus, 1984). Statistical control for social desirability scales has limited ability to remove bias, however, because the scales capture personality traits as well as response tendencies (Nederhof, 1985).
Judging whether a technique works
Researchers usually cannot check individual answers against the truth, so they often judge techniques by the "more is better" rule: for undesirable behaviours, the method that produces higher reports is assumed to be more accurate, and for desirable behaviours, the one that produces lower reports. This rule is reasonable when the direction of the bias is clear, but it can mislead. A technique that confuses respondents can produce higher estimates simply by adding random answers, as some studies of the crosswise model have suggested (Höglinger et al., 2016). The strongest evidence comes from validation studies, in which answers can be compared with records, such as voting records or university files (Kreuter et al., 2008), and from designs that include items with known true values. Where such checks are not possible, results from indirect techniques should be treated as estimates with wide uncertainty rather than as the true value.
Changing a technique in a repeated survey also creates a break in the series. If a tracking survey moves from telephone interviews to a web questionnaire, reports of sensitive behaviours may change because of the reduced bias rather than any real change. Running both methods side by side for a period allows the size of the break to be measured.
Social desirability in business research
Social desirability affects business and consumer research as well as social surveys. Consumers may over-report purchases of environmentally friendly or healthy products, and employees may over-report satisfaction or compliance in surveys they suspect managers will see. Fisher (1993) found that asking consumers what other people think, rather than what they themselves think, could reduce social desirability bias for some topics, although such projective questions raise their own questions about what they measure. Anonymous online surveys conducted by independent organisations, with clear explanations of how results will be reported, help reduce these pressures.
An example
An employer surveys staff about workplace behaviour, including whether they have witnessed or experienced harassment. Previous surveys conducted by human resources staff found very low reported rates. The organisation commissions an independent research firm to run an anonymous web survey, with a clear statement that individual answers will never be shared with the employer and that results will be reported only for groups of at least 20 people. Questions use neutral wording and include a list experiment for the most sensitive item. Reported rates of witnessed harassment are three times higher than in previous surveys, and the list experiment produces a similar estimate to the direct question, suggesting that the new design largely removed the reluctance to report (illustrative example).
Conclusion
Social desirability bias leads respondents to over-report approved behaviour and attitudes and to under-report disapproved ones. It is strongest for sensitive topics, in the presence of others and when respondents doubt confidentiality. Self-administration is the most reliable remedy, supported by private settings, careful wording and clear assurances. Indirect techniques such as randomized response, the crosswise model and list experiments can reduce the bias further for the most sensitive questions, at the cost of precision. Recognising where social desirability is likely and designing to reduce it makes survey knowledge about sensitive matters more trustworthy.
References
Belli, R. F., Traugott, M. W., Young, M., & McGonagle, K. A. (1999). Reducing vote overreporting in surveys: Social desirability, memory failure, and source monitoring. Public Opinion Quarterly, 63(1), 90–108. https://doi.org/10.1086/297704
Bernstein, R., Chadha, A., & Montjoy, R. (2001). Overreporting voting: Why it happens and why it matters. Public Opinion Quarterly, 65(1), 22–44. https://doi.org/10.1086/320036
Blair, G., & Imai, K. (2012). Statistical analysis of list experiments. Political Analysis, 20(1), 47–77. https://doi.org/10.1093/pan/mpr048
Blair, G., Imai, K., & Zhou, Y.-Y. (2015). Design and analysis of the randomized response technique. Journal of the American Statistical Association, 110(511), 1304–1319. https://doi.org/10.1080/01621459.2015.1050028
Bradburn, N. M., Sudman, S., & Wansink, B. (2004). Asking questions: The definitive guide to questionnaire design for market research, political polls, and social and health questionnaires (Rev. ed.). Jossey-Bass.
Crowne, D. P., & Marlowe, D. (1960). A new scale of social desirability independent of psychopathology. Journal of Consulting Psychology, 24(4), 349–354. https://doi.org/10.1037/h0047358
Fisher, R. J. (1993). Social desirability bias and the validity of indirect questioning. Journal of Consumer Research, 20(2), 303–315. https://doi.org/10.1086/209351
Glynn, A. N. (2013). What can we learn with statistical truth serum? Design and analysis of the list experiment. Public Opinion Quarterly, 77(S1), 159–172. https://doi.org/10.1093/poq/nfs070
Höglinger, M., Jann, B., & Diekmann, A. (2016). Sensitive questions in online surveys: An experimental evaluation of different implementations of the randomized response technique and the crosswise model. Survey Research Methods, 10(3), 171–187. https://doi.org/10.18148/srm/2016.v10i3.6703
Holbrook, A. L., & Krosnick, J. A. (2010). Social desirability bias in voter turnout reports: Tests using the item count technique. Public Opinion Quarterly, 74(1), 37–67. https://doi.org/10.1093/poq/nfp065
Johnson, T., Kulesa, P., Cho, Y. I., & Shavitt, S. (2005). The relation between culture and response styles: Evidence from 19 countries. Journal of Cross-Cultural Psychology, 36(2), 264–277. https://doi.org/10.1177/0022022104272905
Kreuter, F., Presser, S., & Tourangeau, R. (2008). Social desirability bias in CATI, IVR, and web surveys: The effects of mode and question sensitivity. Public Opinion Quarterly, 72(5), 847–865. https://doi.org/10.1093/poq/nfn063
Krumpal, I. (2013). Determinants of social desirability bias in sensitive surveys: A literature review. Quality & Quantity, 47(4), 2025–2047. https://doi.org/10.1007/s11135-011-9640-9
Lensvelt-Mulders, G. J. L. M., Hox, J. J., van der Heijden, P. G. M., & Maas, C. J. M. (2005). Meta-analysis of randomized response research: Thirty-five years of validation. Sociological Methods & Research, 33(3), 319–348.
Nederhof, A. J. (1985). Methods of coping with social desirability bias: A review. European Journal of Social Psychology, 15(3), 263–280. https://doi.org/10.1002/ejsp.2420150303
Paulhus, D. L. (1984). Two-component models of socially desirable responding. Journal of Personality and Social Psychology, 46(3), 598–609. https://doi.org/10.1037/0022-3514.46.3.598
Richman, W. L., Kiesler, S., Weisband, S., & Drasgow, F. (1999). A meta-analytic study of social desirability distortion in computer-administered questionnaires, traditional questionnaires, and interviews. Journal of Applied Psychology, 84(5), 754–775. https://doi.org/10.1037/0021-9010.84.5.754
Silver, B. D., Anderson, B. A., & Abramson, P. R. (1986). Who overreports voting? American Political Science Review, 80(2), 613–624. https://doi.org/10.2307/1958277
Singer, E., Von Thurn, D. R., & Miller, E. R. (1995). Confidentiality assurances and response: A quantitative review of the experimental literature. Public Opinion Quarterly, 59(1), 66–77. https://doi.org/10.1086/269458
Sudman, S., & Bradburn, N. M. (1982). Asking questions: A practical guide to questionnaire design. Jossey-Bass.
Tourangeau, R., & Smith, T. W. (1996). Asking sensitive questions: The impact of data collection mode, question format, and question context. Public Opinion Quarterly, 60(2), 275–304. https://doi.org/10.1086/297751
Tourangeau, R., & Yan, T. (2007). Sensitive questions in surveys. Psychological Bulletin, 133(5), 859–883. https://doi.org/10.1037/0033-2909.133.5.859
Warner, S. L. (1965). Randomized response: A survey technique for eliminating evasive answer bias. Journal of the American Statistical Association, 60(309), 63–69. https://doi.org/10.1080/01621459.1965.10480775