
Surveys · Technology and the future
Passive Data Collection Combined With Surveys
Smartphones, wearables and web tracking can record behaviour without asking questions. This article explains how passive data are combined with surveys, what each source adds, the problems of consent, coverage and measurement, and how to design a study that uses both.
Surveys ask people to report what they did, what they think and who they are. For many behaviours, such as how much people walk, how long they spend on their phones or which news websites they visit, those reports are known to be inaccurate. People forget, estimate roughly or give answers that present them favourably. At the same time, the devices that people carry and use every day record many of these behaviours automatically.
Passive data collection means gathering data from such devices without asking respondents to answer questions. A smartphone app may record location, movement and phone use; a wearable fitness tracker may record steps and sleep; a browser plug-in may record websites visited. When these data are collected from survey respondents who agree to share them, they can be combined with survey answers to produce a fuller picture than either source gives alone (Stier et al., 2020; Struminskaya et al., 2020).
This article describes the main types of passive data, what they add to surveys, the problems they raise and how to design studies that combine the two.
Types of passive data
Figure 1 shows the main sources of passive data used alongside surveys.
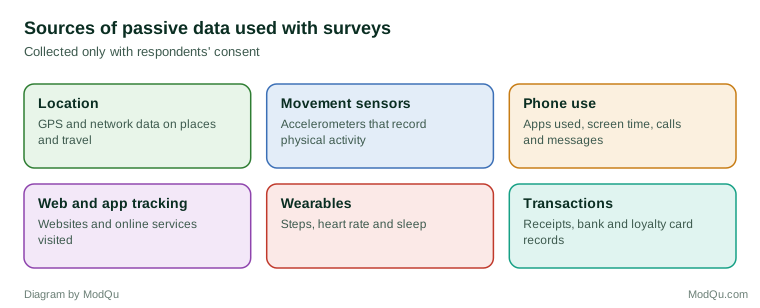
Location data from a phone's GPS and network connections show where people go and how they travel. They are used in studies of commuting, time use and access to services.
Movement sensors, mainly the accelerometer built into phones and wearables, record physical activity and, with suitable algorithms, can distinguish walking, running and travelling in a vehicle.
Phone use data record which apps are used, for how long, and the number of calls and messages, usually without recording their content.
Web and app tracking records which websites and online services a person uses. Tracking software is installed on the respondent's computer or phone with their permission.
Wearable devices, such as fitness trackers and smart watches, record steps, heart rate and sleep.
Transaction data, such as scanned receipts or records shared from a bank or loyalty card, record purchases.
Harari et al. (2016) describe how these smartphone sensors and logs can measure behaviour in daily life, and the practical decisions they require about which data to collect, how often and how to process them.
What passive data add
More accurate measures of behaviour
The most direct benefit is better measurement of behaviours that people report poorly. Studies comparing self-reported and device-measured physical activity have found large differences. A systematic review found that self-reports of physical activity were often higher than direct measures, with considerable variation between studies (Prince et al., 2008). When accelerometers were used in a large American health survey, the share of adults meeting physical activity recommendations was far lower than self-reports had suggested (Troiano et al., 2008).
Media use is another example. Prior (2009) showed that self-reports greatly overstated how many people watched television news, compared with audience measurement data. Scharkow (2016) compared people's reports of their internet use with logged data from their computers and found only moderate agreement. A meta-analysis found that self-reported digital media use was only moderately related to logged use, and that problematic use was even more poorly reported (Parry et al., 2021).
Continuous and detailed data
Surveys capture a moment. Passive data record behaviour continuously over days or months, showing patterns, such as daily routines and changes over time, that a single questionnaire cannot capture. This continuous view links passive measurement to the tradition of ecological momentary assessment, in which people report their experiences repeatedly in daily life (Shiffman et al., 2008).
Reduced burden
Once set up, passive collection asks little of respondents. Instead of keeping a detailed diary of journeys or purchases, a respondent can let the phone record them. That may allow longer measurement periods and reduce the effort that leads to poor diary data.
Context for survey answers
Passive data become most valuable when combined with survey answers. A survey measures attitudes, intentions and explanations, which devices cannot observe. Passive data measure behaviour, which surveys measure poorly. Together they allow researchers to study how attitudes relate to behaviour. Guess et al. (2020), for example, combined survey responses with web tracking data to study who visited untrustworthy news websites during an American election, relating actual visits to respondents' political attitudes.
Smartphones can also trigger short surveys at relevant moments, for example when a sensor shows that a person has arrived at a new location or has been inactive for a long time. Such event-triggered questions combine passive detection with active reporting.
Data donation
A newer approach avoids installing tracking software. Under data protection laws such as the European Union's General Data Protection Regulation, people have the right to obtain a copy of the data that online platforms hold about them. In data donation, researchers ask survey respondents to download these copies, for example their search history, viewing history or screen-time statistics, and share them with the study. Respondents can usually see and remove items before donating, which gives them more control than continuous tracking.
Boeschoten et al. (2022) describe a framework for collecting donated data in a way that protects privacy, in which the data are processed on the respondent's own device and only the summary measures needed for the research are sent to the researcher. Ohme et al. (2021) asked respondents to report their smartphone use and then to donate screenshots of the screen-time statistics recorded by their phones. Self-reports differed considerably from the recorded data, and those who agreed to donate differed from those who did not.
Data donation has its own limits. The process can be complicated, which reduces participation, and platforms change the format of their data without notice. But it offers a way to collect behavioural data with clearer consent and less ongoing intrusion.
The problems
Consent and willingness
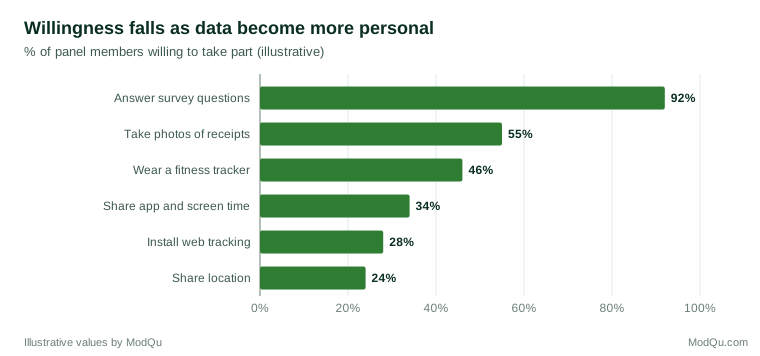
Passive data collection depends on respondents agreeing to share data that many regard as private. Willingness varies greatly by type of data and by the purpose described. Keusch et al. (2019) found that willingness to install a research app that collects data passively was considerably lower than willingness to answer questions, and was lowest for data that seem most intrusive, such as location and phone use. People were more willing when they could control the data collection, for example by switching it off temporarily, and when they trusted the organisation collecting it. Revilla et al. (2019) found similar patterns among members of online panels in several countries.
Figure 2 illustrates the typical pattern: willingness falls as data become more personal.
Coverage and selection bias
Not everyone has a smartphone or wearable, and not everyone who has one is willing to install an app. Those who take part in passive data collection differ from those who do not, often being younger, more educated and more comfortable with technology. Jäckle et al. (2019) studied participation in an app to record spending, offered to members of a large probability household panel in the United Kingdom. Only a minority took part, and participants differed from non-participants in several respects, although some differences were small after adjustment. Elevelt et al. (2019) found similar patterns of selective participation in a smartphone time-use study.
These selection effects can bias conclusions. If only people who are comfortable with technology agree to tracking, estimates of digital media use may be biased upwards. Researchers need to measure who takes part at each stage and use the survey data to adjust for differences where possible.
Measurement error in passive data
Passive data are not error-free. Sensors fail, batteries die, phones are left at home, and operating systems restrict what apps can record. Different phone models record movement differently. Algorithms that convert raw signals into meaningful categories, such as "walking" or "in a car", make mistakes. Web tracking may miss activity on devices where the software is not installed. A person who shares a phone or a computer with others will have their data mixed with others' data.
Frameworks developed for survey error have been extended to these new sources of data, identifying errors that arise in how data are generated, captured, processed and analysed (Amaya et al., 2020; Japec et al., 2015). The lesson from such frameworks is that passive data are a different kind of measurement with their own errors, not a perfect record of behaviour. Lazer et al. (2014) showed how relying on digital data without understanding how they were generated can produce large errors, using the example of Google Flu Trends.
Validity of the construct
Passive data measure what devices can record, which may not be the concept the researcher cares about. Time spent in a social media app does not show whether the person was reading news, talking with friends or scrolling idly. The number of steps does not capture swimming or cycling. Researchers need to be clear about which concept each measure represents.
Privacy
Passive data can be highly revealing. Location data show where people live and work, whom they visit and which places they go to, such as clinics or places of worship. Only a few location points can be enough to identify a person uniquely within a large data set (de Montjoye et al., 2013). Kreuter et al. (2020) describe the steps taken in a large German study to explain data collection to respondents, give them control and protect their privacy. Such measures include collecting only the data needed, processing data on the device where possible, separating identifiers from behavioural data and setting clear limits on how long data are kept.
Analysing combined data
Combining passive data with survey answers raises analytical choices. Passive data are usually recorded at a much finer level than survey answers: thousands of location points or website visits per person, compared with one answer per question. Analysts must decide how to summarise them, for example as average daily steps, the number of trips per week or the share of news visits to particular sites. These choices affect results and should be made, and reported, before looking at the relationships of interest.
Missing passive data are common and rarely random. Data may be missing because a phone was switched off, because a respondent paused collection or because they stopped taking part. Analysts should examine patterns of missing data and consider whether they are related to the behaviours being measured. A respondent who pauses location tracking during certain activities, for example, may be the very person whose behaviour the study most needs to observe.
Comparisons between passive measures and self-reports for the same people are valuable in themselves. They show how accurate survey questions are, and for whom, which can improve the interpretation of surveys that cannot include passive data.
Designing a study
Several practices help researchers combine passive data with surveys well:
- Start from the research question. Collect only the passive data needed to measure the concepts of interest. More data are not always better and increase privacy risks and processing costs.
- Explain clearly and ask specifically. Describe each type of data, what it will be used for and how it will be protected. Ask for consent to each type separately.
- Give respondents control. Let respondents pause data collection, see what has been recorded and withdraw at any time.
- Offer incentives where appropriate. Payments for installing an app and keeping it active can increase participation, though they may also affect who takes part.
- Track participation at each step. Record who was invited, who agreed, who installed the app and who kept it running, and compare each group with the full sample using survey data.
- Validate the measures. Compare passive measures with other sources, such as a diary for a subsample, and check how algorithms classify activity.
- Plan the data processing. Passive data are large and messy. Decide in advance how they will be cleaned, summarised and linked with survey answers.
- Keep the survey. Passive data cannot measure attitudes, reasons or identities. A survey remains essential for interpreting behaviour.
Hard-to-reach groups
Passive data collection can sometimes help include people who are difficult to survey by traditional means. Sugie (2018) gave smartphones to men recently released from prison and used a combination of short surveys and passive data to study their search for work. The phones allowed frequent contact with a group that is hard to follow with conventional surveys. The study also shows the importance of ethical care when collecting detailed data from vulnerable people.
The broader direction
Groves (2011) argued that survey research was entering a new era in which surveys would increasingly be combined with data generated by other systems. Couper (2013) reviewed the challenges new technologies present to surveys and concluded that surveys would remain essential, because they measure things that other data do not, but would be combined with new data sources more often.
Health research offers one view of where this may lead. Onnela and Rauch (2016) described digital phenotyping, the use of continuous smartphone data to measure behaviour and mental health in daily life. Similar approaches are being explored in studies of mobility, consumer behaviour and media use. The challenge for survey researchers is to bring the standards of survey methodology, careful attention to coverage, consent, measurement and error, to these new kinds of data.
An example
A city transport agency wants to understand how residents travel to work. Its usual travel survey asks respondents to record a day of journeys in a diary. The agency invites 3,000 survey respondents to install an app that records location for two weeks.
Of those invited, 35 per cent agree, and 26 per cent keep the app running for the full period. App users are younger than the full sample and more likely to drive. The app data show that people make about 20 per cent more short trips than they report in diaries, mostly walking trips under ten minutes. The survey answers explain why many people prefer to drive. The agency weights the app data using survey information, reports the participation rates at each step and uses both sources in planning. It also uses the comparison to improve its diary: the next diary includes a prompt reminding respondents to record short walks, and a small group of respondents completes both the diary and the app each year so that the agency can monitor how far the two sources differ over time (illustrative example).
Conclusion
Passive data from phones, wearables and online tracking can measure behaviour more accurately and continuously than survey questions, with less burden on respondents. Combined with surveys, they let researchers study how attitudes, circumstances and behaviour relate. But passive data bring their own problems: many people decline to share them, those who do are not representative, sensors and algorithms make errors and the data can reveal private details of people's lives. Studies that combine the two sources work best when they are designed around a clear research question, ask for informed and specific consent, measure who takes part and treat passive data as another form of measurement that needs validation.
References
Amaya, A., Biemer, P. P., & Kinyon, D. (2020). Total error in a big data world: Adapting the TSE framework to big data. Journal of Survey Statistics and Methodology, 8(1), 89–119. https://doi.org/10.1093/jssam/smz056
Boeschoten, L., Ausloos, J., Möller, J. E., Araujo, T., & Oberski, D. L. (2022). A framework for privacy preserving digital trace data collection through data donation. Computational Communication Research, 4(2), 388–423. https://doi.org/10.5117/CCR2022.2.002.BOES
Couper, M. P. (2013). Is the sky falling? New technology, changing media, and the future of surveys. Survey Research Methods, 7(3), 145–156. https://doi.org/10.18148/srm/2013.v7i3.5751
de Montjoye, Y.-A., Hidalgo, C. A., Verleysen, M., & Blondel, V. D. (2013). Unique in the crowd: The privacy bounds of human mobility. Scientific Reports, 3, Article 1376. https://doi.org/10.1038/srep01376
Elevelt, A., Lugtig, P., & Toepoel, V. (2019). Doing a time use survey on smartphones only: What factors predict nonresponse at different stages of the survey process? Survey Research Methods, 13(2), 195–213. https://doi.org/10.18148/srm/2019.v13i2.7385
Groves, R. M. (2011). Three eras of survey research. Public Opinion Quarterly, 75(5), 861–871. https://doi.org/10.1093/poq/nfr057
Guess, A. M., Nyhan, B., & Reifler, J. (2020). Exposure to untrustworthy websites in the 2016 US election. Nature Human Behaviour, 4(5), 472–480. https://doi.org/10.1038/s41562-020-0833-x
Harari, G. M., Lane, N. D., Wang, R., Crosier, B. S., Campbell, A. T., & Gosling, S. D. (2016). Using smartphones to collect behavioral data in psychological science: Opportunities, practical considerations, and challenges. Perspectives on Psychological Science, 11(6), 838–854. https://doi.org/10.1177/1745691616650285
Japec, L., Kreuter, F., Berg, M., Biemer, P., Decker, P., Lampe, C., Lane, J., O'Neil, C., & Usher, A. (2015). Big data in survey research: AAPOR task force report. Public Opinion Quarterly, 79(4), 839–880. https://doi.org/10.1093/poq/nfv039
Jäckle, A., Burton, J., Couper, M. P., & Lessof, C. (2019). Participation in a mobile app survey to collect expenditure data as part of a large-scale probability household panel: Coverage and participation rates and biases. Survey Research Methods, 13(1), 23–44. https://doi.org/10.18148/srm/2019.v13i1.7297
Keusch, F., Struminskaya, B., Antoun, C., Couper, M. P., & Kreuter, F. (2019). Willingness to participate in passive mobile data collection. Public Opinion Quarterly, 83(S1), 210–235. https://doi.org/10.1093/poq/nfz007
Kreuter, F., Haas, G.-C., Keusch, F., Bähr, S., & Trappmann, M. (2020). Collecting survey and smartphone sensor data with an app: Opportunities and challenges around privacy and informed consent. Social Science Computer Review, 38(5), 533–549. https://doi.org/10.1177/0894439318816389
Lazer, D., Kennedy, R., King, G., & Vespignani, A. (2014). The parable of Google Flu: Traps in big data analysis. Science, 343(6176), 1203–1205. https://doi.org/10.1126/science.1248506
Ohme, J., Araujo, T., de Vreese, C. H., & Piotrowski, J. T. (2021). Mobile data donations: Assessing self-report accuracy and sample biases with the iOS Screen Time function. Mobile Media & Communication, 9(2), 293–313. https://doi.org/10.1177/2050157920959106
Onnela, J.-P., & Rauch, S. L. (2016). Harnessing smartphone-based digital phenotyping to enhance behavioral and mental health. Neuropsychopharmacology, 41(7), 1691–1696. https://doi.org/10.1038/npp.2016.7
Parry, D. A., Davidson, B. I., Sewall, C. J. R., Fisher, J. T., Mieczkowski, H., & Quintana, D. S. (2021). A systematic review and meta-analysis of discrepancies between logged and self-reported digital media use. Nature Human Behaviour, 5(11), 1535–1547. https://doi.org/10.1038/s41562-021-01117-5
Prince, S. A., Adamo, K. B., Hamel, M. E., Hardt, J., Connor Gorber, S., & Tremblay, M. (2008). A comparison of direct versus self-report measures for assessing physical activity in adults: A systematic review. International Journal of Behavioral Nutrition and Physical Activity, 5, Article 56. https://doi.org/10.1186/1479-5868-5-56
Prior, M. (2009). The immensely inflated news audience: Assessing bias in self-reported news exposure. Public Opinion Quarterly, 73(1), 130–143. https://doi.org/10.1093/poq/nfp002
Revilla, M., Couper, M. P., & Ochoa, C. (2019). Willingness of online panelists to perform additional tasks. Methods, Data, Analyses, 13(2), 223–252.
Scharkow, M. (2016). The accuracy of self-reported internet use: A validation study using client log data. Communication Methods and Measures, 10(1), 13–27. https://doi.org/10.1080/19312458.2015.1118446
Shiffman, S., Stone, A. A., & Hufford, M. R. (2008). Ecological momentary assessment. Annual Review of Clinical Psychology, 4, 1–32. https://doi.org/10.1146/annurev.clinpsy.3.022806.091415
Stier, S., Breuer, J., Siegers, P., & Thorson, K. (2020). Integrating survey data and digital trace data: Key issues in developing an emerging field. Social Science Computer Review, 38(5), 503–516. https://doi.org/10.1177/0894439319843669
Struminskaya, B., Lugtig, P., Keusch, F., & Höhne, J. K. (2020). Augmenting surveys with data from sensors and apps: Opportunities and challenges. Social Science Computer Review. Advance online publication. https://doi.org/10.1177/0894439320979951
Sugie, N. F. (2018). Utilizing smartphones to study disadvantaged and hard-to-reach groups. Sociological Methods & Research, 47(3), 458–491. https://doi.org/10.1177/0049124115626176
Troiano, R. P., Berrigan, D., Dodd, K. W., Mâsse, L. C., Tilert, T., & McDowell, M. (2008). Physical activity in the United States measured by accelerometer. Medicine & Science in Sports & Exercise, 40(1), 181–188. https://doi.org/10.1249/mss.0b013e31815a51b3