
Surveys · Technology and the future
Online Survey Platforms: Features That Affect Data Quality
The software used to build and run an online survey shapes the answers it collects. This article explains which platform features affect data quality, from screen layout and answer checks to device handling, paradata and fraud protection, and how to choose and set up a platform with quality in mind.
Most surveys today are completed on a screen. The questionnaire is written in a survey platform, a piece of software that displays the questions, records the answers and stores the data. It is easy to treat the platform as a neutral tool that simply carries the questionnaire to respondents. Research on web surveys shows that this is not the case. The way a platform lays out questions, checks answers, adapts to phones and records what respondents do can change the answers people give, how many finish and how much the researcher can learn about the quality of the data (Couper, 2008; Tourangeau et al., 2013).
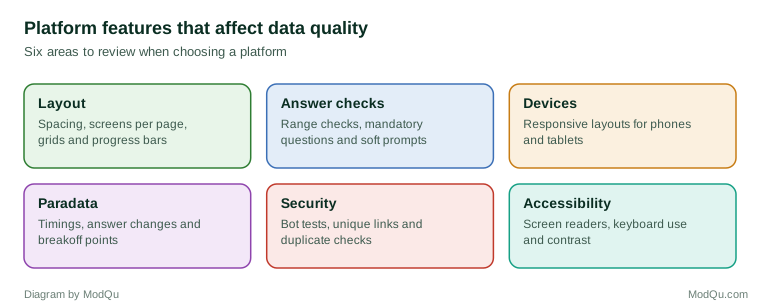
This article describes the platform features that matter most for data quality and how researchers can use them well. Figure 1 groups them into six areas.
Layout and visual design
In a self-administered survey there is no interviewer to explain what a question means. Respondents rely on what they see. Tourangeau et al. (2004) showed that respondents use visual cues, such as the spacing of response options and their position on the screen, to interpret questions. A scale whose midpoint is not in the visual centre, or whose options are unevenly spaced, can shift answers. A platform's templates, themes and default styles therefore have a direct effect on measurement.
Platforms also differ in how they divide a questionnaire into screens. In a scrolling design, many questions appear on one long page; in a paging design, each screen holds one question or a small group. Peytchev et al. (2006) compared the two and found small differences in completion time and in how often respondents skipped questions, with paging making it easier to apply skips and checks. Grids, in which several items share one response scale, save space but encourage respondents to give the same answer to every row, a pattern known as straightlining (Couper et al., 2013).
Progress indicators are a standard platform feature. They seem helpful, but a meta-analysis of experiments found that they do not reduce breakoff on average, and that indicators which move slowly at the start can increase it (Villar et al., 2013). A platform that lets researchers turn the indicator off, or control how it advances, gives more control over this effect.
Response formats matter too. Most platforms offer sliders, drag-and-drop ranking and other interactive controls alongside radio buttons. Funke et al. (2011) found that sliders produced more breakoff and longer completion times than simple radio buttons, especially among respondents with less formal education. New controls should be tested before they are used in a live survey.
Answer checks and forced responses
Platforms can check answers as they are entered. A check might reject a number outside a plausible range, ask a respondent to confirm an unusual answer or ensure that percentages add to 100. Such checks reduce errors that would otherwise need to be cleaned later.
Many platforms also allow a question to be made mandatory, so that the respondent cannot continue without answering. This removes missing answers to that question but can have costs. Décieux et al. (2015) found that forcing answers increased breakoff and could lower the quality of answers, as some respondents chose any option simply to move on. A softer approach, a soft prompt, asks respondents to answer if they can but allows them to continue. Many methodologists prefer soft prompts for most questions, keeping hard requirements for screening questions that control routing.
Devices and mobile design
A large share of online respondents now answer on smartphones. Respondents who use phones take longer and break off more often when a questionnaire is designed for a large screen (Couper et al., 2017; Tourangeau et al., 2018). A good platform detects the device and adjusts the layout, a feature called responsive design. Wide grids, for example, can be shown as a series of single questions on a phone. Revilla and Couper (2018) found that item-by-item formats worked better than grids on smartphones.
Mavletova and Couper (2014) found that on phones, paging designs with fewer questions per screen led to fewer breakoffs than long scrolling pages. Antoun et al. (2018) summarised design rules for smartphone questionnaires: readable text without zooming, large touch targets, minimal horizontal scrolling and short screens. Researchers should preview every questionnaire on several phones before launch, because what looks clear on a laptop can be hard to use on a small screen.
Paradata
Online platforms can record paradata, data about the process of answering, such as how long each screen took, which answers were changed and whether the respondent left the page (Kreuter, 2013). Heerwegh (2003) showed how such data, recorded within the respondent's browser, could reveal hesitation and answer changes that point to difficult questions.
Paradata are among the most useful quality tools a platform provides. Time per screen identifies speeders, respondents who answer too quickly to have read the questions. Leiner (2019) found that a simple index of speed relative to other respondents was one of the most effective indicators of meaningless data. Breakoff points show which questions cause respondents to give up. Researchers should check what paradata a platform records, whether it can be exported and at what level of detail. Because paradata describe respondent behaviour, respondents should be told that they are collected (Couper & Singer, 2013).
Security and fraud protection
Open online surveys attract fraudulent responses: automated programs (bots), people taking the same survey many times and respondents who misrepresent themselves to qualify for incentives. A Pew Research Center study found that bogus respondents in some opt-in samples could bias estimates noticeably, especially for small subgroups (Kennedy et al., 2020).
Platform features that help include CAPTCHA tests, unique survey links, checks for duplicate devices, hidden questions that only bots answer and flags for inconsistent answers. No single tool is sufficient, so most researchers combine several platform checks with review of the data after collection.
Accessibility
A platform should allow people with disabilities to take part. That means support for screen readers, keyboard navigation, adjustable text size and good colour contrast. Platforms vary widely in this respect. A survey that cannot be completed with a screen reader excludes some respondents entirely, which affects both fairness and coverage. Accessibility should be checked with the platform's own tools and, where possible, with real assistive technology.
Data handling and security of storage
The platform also stores the data. Researchers should know where the servers are located, how data are encrypted, who can access them and how long they are kept. These questions matter for data protection law and for the trust respondents place in the survey. A platform that cannot answer them clearly is a risk to any study that collects personal information.
Choosing and setting up a platform
No platform is best for every study. A short customer feedback survey has different needs from a long academic questionnaire with complex routing. The following checks are useful when choosing and setting up a platform (Callegaro et al., 2015):
- Test the respondent's view. Complete the survey on a desktop, a tablet and at least two phones. Check that scales are evenly spaced and grids adapt to small screens.
- Review default settings. Defaults for mandatory questions, progress indicators, randomisation and time-outs may not suit the study. Change them deliberately.
- Check what is recorded. Confirm that timings, device type and breakoff points are recorded and can be exported with the answers.
- Plan fraud checks. Decide in advance which platform checks to switch on and which data checks to apply afterwards.
- Pilot the full process. Run a small soft launch, inspect the data and paradata and fix problems before the main fieldwork.
An example
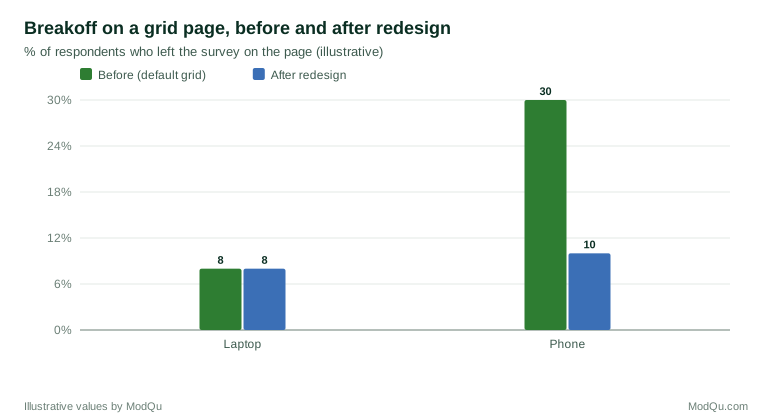
A research team runs an employee survey on a platform's default template. The pilot shows that 30 per cent of phone respondents leave the survey on a page with a 12-row grid, compared with 8 per cent on laptops. The paradata also show that a mandatory question on salary has an unusually high share of answers in the first option. The team switches the grid to an item-by-item format on phones and changes the salary question to a soft prompt with a "prefer not to say" option. In the main survey, breakoff on phones falls to 10 per cent and the salary answers look more plausible (illustrative example). Figure 2 shows the change.
Conclusion
An online survey platform is part of the measurement process, not just a delivery tool. Its layout, answer checks, device handling, paradata, security features and accessibility all influence the quality of the data. Researchers who understand these features, review the defaults and test the survey on the devices respondents actually use will collect better data and learn more about its quality from the platform itself.
References
Antoun, C., Katz, J., Argueta, J., & Wang, L. (2018). Design heuristics for effective smartphone questionnaires. Social Science Computer Review, 36(5), 557–574. https://doi.org/10.1177/0894439317727072
Callegaro, M., Lozar Manfreda, K., & Vehovar, V. (2015). Web survey methodology. SAGE. https://doi.org/10.4135/9781529799651
Couper, M. P., & Singer, E. (2013). Informed consent for web paradata use. Survey Research Methods, 7(1), 57–67. https://doi.org/10.18148/srm/2013.v7i1.5138
Couper, M. P. (2008). Designing effective web surveys. Cambridge University Press. https://doi.org/10.1017/CBO9780511499371
Couper, M. P., Antoun, C., & Mavletova, A. (2017). Mobile web surveys: A total survey error perspective. In P. P. Biemer, E. de Leeuw, S. Eckman, B. Edwards, F. Kreuter, L. E. Lyberg, N. C. Tucker, & B. T. West (Eds.), Total survey error in practice (pp. 133–154). Wiley.
Couper, M. P., Tourangeau, R., Conrad, F. G., & Zhang, C. (2013). The design of grids in web surveys. Social Science Computer Review, 31(3), 322–345. https://doi.org/10.1177/0894439312469865
Décieux, J. P., Mergener, A., Neufang, K. M., & Sischka, P. (2015). Implementation of the forced answering option within online surveys: Do higher item response rates come at the expense of participation and answer quality? Psihologija, 48(4), 311–326. https://doi.org/10.2298/PSI1504311D
Funke, F., Reips, U.-D., & Thomas, R. K. (2011). Sliders for the smart: Type of rating scale on the web interacts with educational level. Social Science Computer Review, 29(2), 221–231. https://doi.org/10.1177/0894439310376896
Heerwegh, D. (2003). Explaining response latencies and changing answers using client-side paradata from a web survey. Social Science Computer Review, 21(3), 360–373. https://doi.org/10.1177/0894439303253985
Kennedy, C., Hatley, N., Lau, A., Mercer, A., Keeter, S., Ferno, J., & Asare-Marfo, D. (2020). Assessing the risks to online polls from bogus respondents. Pew Research Center.
Kreuter, F. (Ed.). (2013). Improving surveys with paradata: Analytic uses of process information. Wiley. https://doi.org/10.1002/9781118596869
Leiner, D. J. (2019). Too fast, too straight, too weird: Non-reactive indicators for meaningless data in internet surveys. Survey Research Methods, 13(3), 229–248. https://doi.org/10.18148/srm/2019.v13i3.7403
Mavletova, A., & Couper, M. P. (2014). Mobile web survey design: Scrolling versus paging, SMS versus e-mail invitations. Journal of Survey Statistics and Methodology, 2(4), 498–518. https://doi.org/10.1093/jssam/smu015
Peytchev, A., Couper, M. P., McCabe, S. E., & Crawford, S. D. (2006). Web survey design: Paging versus scrolling. Public Opinion Quarterly, 70(4), 596–607. https://doi.org/10.1093/poq/nfl028
Revilla, M., & Couper, M. P. (2018). Comparing grids with vertical and horizontal item-by-item formats for PCs and smartphones. Social Science Computer Review, 36(3), 349–368. https://doi.org/10.1177/0894439317715626
Tourangeau, R., Conrad, F. G., & Couper, M. P. (2013). The science of web surveys. Oxford University Press. https://doi.org/10.1093/acprof:oso/9780199747047.001.0001
Tourangeau, R., Couper, M. P., & Conrad, F. (2004). Spacing, position, and order: Interpretive heuristics for visual features of survey questions. Public Opinion Quarterly, 68(3), 368–393. https://doi.org/10.1093/poq/nfh035
Tourangeau, R., Sun, H., Yan, T., Maitland, A., Rivero, G., & Williams, D. (2018). Web surveys by smartphones and tablets: Effects on data quality. Social Science Computer Review, 36(5), 542–556. https://doi.org/10.1177/0894439317719438
Villar, A., Callegaro, M., & Yang, Y. (2013). Where am I? A meta-analysis of experiments on the effects of progress indicators for web surveys. Social Science Computer Review, 31(6), 744–762. https://doi.org/10.1177/0894439313497468