
Surveys · Incentives and engagement
Measuring Survey Climate and Public Trust as Predictors of Participation and Data Quality
The willingness of the public to take part in surveys depends on attitudes towards surveys, trust in research organisations and concerns about privacy. This article explains how this "survey climate" is measured and what the evidence shows about its links with participation and data quality.
Survey response rates have fallen in many countries over several decades (de Leeuw & de Heer, 2002; Luiten et al., 2020). Explanations include busier lives, more screening of telephone calls and more requests for feedback. Underlying many of these explanations is a broader idea: the survey climate, meaning the general attitudes of a population towards surveys, the organisations that conduct them and the use of the information they collect. If the public comes to see surveys as a nuisance, a sales technique or a threat to privacy, every survey will find it harder to recruit respondents and to obtain honest answers.
This article explains how survey climate and public trust are measured and reviews the evidence on how they predict participation and data quality.
What is survey climate?
The term describes the shared social context in which survey requests are received. Groves and Couper (1998) included the survey-taking climate among the social influences on participation, alongside factors such as urbanisation and the frequency of survey requests. A favourable climate is one in which people see surveys as legitimate, useful and safe; an unfavourable one is marked by suspicion, fatigue and concern about misuse of data.
Survey climate overlaps with wider forms of trust. People who trust other people and public institutions are more likely to take part in surveys, particularly those sponsored by government (Brick & Williams, 2013). Concerns about privacy and data protection also form part of the climate. Singer et al. (1993) found that people who expressed concern about privacy and confidentiality were less likely to return their census forms.
Measuring attitudes towards surveys
Researchers have developed scales to measure attitudes towards surveys. Figure 1 summarises five dimensions that such measures commonly cover.
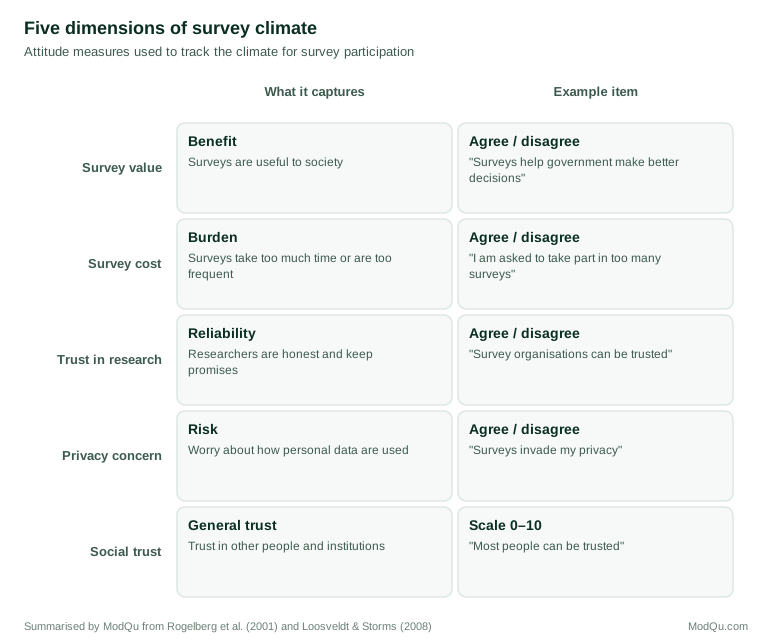
Rogelberg et al. (2001) developed a measure of attitudes towards surveys with two main components: survey enjoyment, whether people like taking part, and survey value, whether they believe surveys are useful. Loosveldt and Storms (2008) developed and tested a scale measuring public opinion about surveys in Belgium, covering the perceived value of surveys, their cost in time and effort, and the reliability of survey organisations. Such scales can be included in surveys themselves or in dedicated studies of public attitudes.
Surveys about surveys have a long history. Goyder (1986) reviewed early studies of public attitudes towards surveys and discussed their limitations, especially that they can only measure the views of people willing to answer a survey. Kim et al. (2011) compiled trends in survey questions about surveys in the United States and found that, over several decades, the public had become more sceptical about the accuracy of polls and less willing to take part, although most people still considered surveys useful.
Attitudes and participation
The central question is whether attitudes towards surveys predict behaviour. Evidence suggests that they do. Rogelberg et al. (2001) found that students with more positive attitudes towards surveys were more likely to respond to a later survey request, to follow instructions and to complete optional items. Stocké and Langfeldt (2004) found that respondents' attitudes towards surveys were shaped by their experiences of being interviewed, and that people with negative experiences were less willing to participate in future. Figure 2 illustrates the relationship.
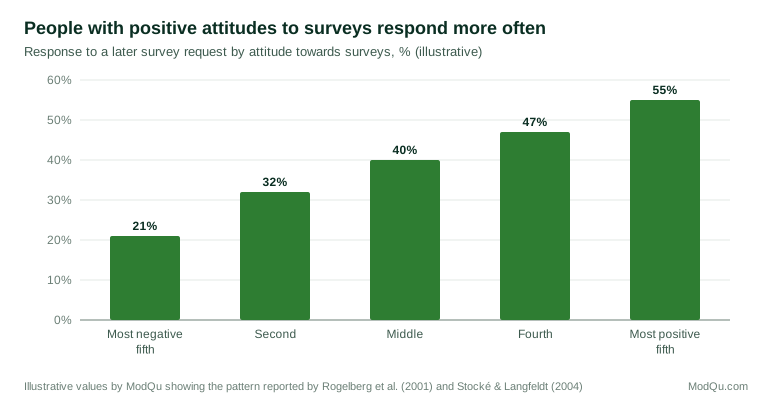
At the population level, it is harder to show that changes in climate cause changes in response, because many factors change at once. Brick and Williams (2013) examined trends in nonresponse in household surveys in the United States and considered explanations including declining social trust and civic engagement. They found patterns consistent with these explanations, though they noted that the evidence was indirect. Curtin et al. (2005) documented rising refusal rates in a long-running telephone survey, which suggests a growing unwillingness to participate among those who are reached.
Attitudes and data quality
Climate may affect the quality of answers as well as participation. Respondents who view surveys as valuable may make more effort to answer carefully, while those who are sceptical may satisfice. Rogelberg et al. (2001) found that more positive attitudes were associated with better compliance with survey instructions. Respondents who distrust the organisation may also be more likely to refuse sensitive questions or give socially acceptable answers. Couper et al. (2008) found that concerns about privacy and the perceived sensitivity of the topic influenced people's stated willingness to take part in surveys.
Trust in official statistics
Government surveys and censuses depend especially on public trust. People are more likely to complete official questionnaires when they trust the agency, believe that their answers will be kept confidential and see the information as serving a public purpose. Couper et al. (1998) studied participation in the 1990 United States census and found that attitudes towards government, concerns about privacy and beliefs about the confidentiality of census data were related to whether people returned their forms. Events that raise doubts about data protection, such as publicised data breaches or proposals to share survey data with other authorities, can reduce participation in official surveys well beyond the agency directly involved.
Differences between countries and groups
Survey climate varies between countries and between groups within them. Stoop et al. (2010) analysed response in the European Social Survey and found large differences between countries in response and refusal rates, reflecting differences in fieldwork practice as well as in public attitudes. Within countries, people with lower social trust, less education or weaker attachment to civic life are often less willing to take part. Because these characteristics are related to many survey topics, such as political participation, volunteering and trust itself, differences in survey climate between groups can produce nonresponse bias. Leverage-saliency theory suggests that different features of a request, such as the sponsor or an incentive, carry different weight for people with different attitudes, which offers a way to reach those who distrust surveys (Groves et al., 2000).
Attitudes and panel attrition
In panel surveys, attitudes towards the survey can be measured directly and used to predict who will leave. Members who report that the questionnaire was too long, uninteresting or intrusive are more likely to drop out in later waves. Lugtig (2014) distinguished groups of panel members with different patterns of participation, including those who leave quickly, those who leave gradually and those who stay but answer less carefully, and found that commitment to the panel helped explain these patterns. Brief questions at the end of each wave about the respondent's experience provide an early warning of attrition.
Using climate measures
Measures of survey climate can be used in several ways:
- Monitoring trends. Repeated measurement of attitudes towards surveys shows whether the climate is improving or worsening, which helps explain trends in response.
- Nonresponse adjustment. Where attitudes are measured among respondents to earlier waves of a panel, they can predict later attrition and be included in weighting models.
- Targeting effort. Panel members or populations with negative attitudes may need different approaches, such as stronger explanations of purpose or more assurances about data protection.
- Evaluating practice. Organisations can assess whether their own surveys leave respondents with positive or negative impressions, for example by asking a short question at the end of each questionnaire.
Limitations
Measuring survey climate faces a basic problem: the people with the most negative attitudes are least likely to answer questions about them. Estimates of attitudes towards surveys based on respondents are therefore likely to be more positive than those of the whole population (Goyder, 1986). Panel studies, which measure attitudes before people decide whether to continue, and studies that include brief questions at the doorstep, partly overcome this problem. Attitudes also differ between types of survey: people may trust a university study but not a marketing survey, so general measures may hide important differences.
Improving the climate
Because the climate is shared, each organisation's practice affects all others. Practices that damage it include surveys used to sell products, "push polls" designed to spread misleading information, excessively long questionnaires, broken promises about length or incentives and careless handling of personal data. Practices that improve it include honest invitations, short and relevant questionnaires, strong data protection, respect for refusals and sharing results with respondents (Dillman et al., 2014). Professional bodies support a good climate through codes of conduct that set standards for all members.
An example
A research institute adds four questions on attitudes towards surveys to the first wave of a new online panel. Two years later, members in the most negative fifth on these questions have left the panel at more than twice the rate of those in the most positive fifth. The institute adds the attitude score to its attrition weighting model, shortens the questionnaire for members who reported it as too long and sends all members a short summary of findings after each wave. Attrition among the most negative group falls in the following year (illustrative example).
Conclusion
Survey climate, the public's attitudes towards surveys and trust in the organisations that conduct them, is an important influence on whether people take part and how carefully they answer. It can be measured with established scales and tracked over time, and these measures predict participation and some aspects of data quality. Because people with negative attitudes are hardest to reach, measuring climate requires care. Improving it is a collective task: each survey that respects respondents' time and trust makes the next survey easier.
References
Brick, J. M., & Williams, D. (2013). Explaining rising nonresponse rates in cross-sectional surveys. The Annals of the American Academy of Political and Social Science, 645(1), 36–59. https://doi.org/10.1177/0002716212456834
Couper, M. P., Singer, E., & Kulka, R. A. (1998). Participation in the 1990 decennial census: Politics, privacy, pressures. American Politics Quarterly, 26(1), 59–80. https://doi.org/10.1177/1532673X9802600104
Couper, M. P., Singer, E., Conrad, F. G., & Groves, R. M. (2008). Risk of disclosure, perceptions of risk, and concerns about privacy and confidentiality as factors in survey participation. Journal of Official Statistics, 24(2), 255–275.
Curtin, R., Presser, S., & Singer, E. (2005). Changes in telephone survey nonresponse over the past quarter century. Public Opinion Quarterly, 69(1), 87–98. https://doi.org/10.1093/poq/nfi002
de Leeuw, E., & de Heer, W. (2002). Trends in household survey nonresponse: A longitudinal and international comparison. In R. M. Groves, D. A. Dillman, J. L. Eltinge, & R. J. A. Little (Eds.), Survey nonresponse (pp. 41–54). Wiley.
Dillman, D. A., Smyth, J. D., & Christian, L. M. (2014). Internet, phone, mail, and mixed-mode surveys: The tailored design method (4th ed.). Wiley.
Goyder, J. (1986). Surveys on surveys: Limitations and potentialities. Public Opinion Quarterly, 50(1), 27–41. https://doi.org/10.1086/268957
Groves, R. M., & Couper, M. P. (1998). Nonresponse in household interview surveys. Wiley. https://doi.org/10.1002/9781118490082
Groves, R. M., Singer, E., & Corning, A. (2000). Leverage-saliency theory of survey participation: Description and an illustration. Public Opinion Quarterly, 64(3), 299–308. https://doi.org/10.1086/317990
Kim, J., Gershenson, C., Glaser, P., & Smith, T. W. (2011). The polls—trends: Trends in surveys on surveys. Public Opinion Quarterly, 75(1), 165–191. https://doi.org/10.1093/poq/nfq047
Loosveldt, G., & Storms, V. (2008). Measuring public opinions about surveys. International Journal of Public Opinion Research, 20(1), 74–89. https://doi.org/10.1093/ijpor/edn006
Lugtig, P. (2014). Panel attrition: Separating stayers, fast attriters, gradual attriters, and lurkers. Sociological Methods & Research, 43(4), 699–723. https://doi.org/10.1177/0049124113520305
Luiten, A., Hox, J., & de Leeuw, E. (2020). Survey nonresponse trends and fieldwork effort in the 21st century: Results of an international study across countries and surveys. Journal of Official Statistics, 36(3), 469–487. https://doi.org/10.2478/jos-2020-0025
Rogelberg, S. G., Fisher, G. G., Maynard, D. C., Hakel, M. D., & Horvath, M. (2001). Attitudes toward surveys: Development of a measure and its relationship to respondent behavior. Organizational Research Methods, 4(1), 3–25. https://doi.org/10.1177/109442810141001
Singer, E., Mathiowetz, N. A., & Couper, M. P. (1993). The impact of privacy and confidentiality concerns on survey participation: The case of the 1990 U.S. Census. Public Opinion Quarterly, 57(4), 465–482. https://doi.org/10.1086/269391
Stocké, V., & Langfeldt, B. (2004). Effects of survey experience on respondents' attitudes towards surveys. Bulletin de Méthodologie Sociologique, 81(1), 5–32. https://doi.org/10.1177/075910630408100103
Stoop, I., Billiet, J., Koch, A., & Fitzgerald, R. (2010). Improving survey response: Lessons learned from the European Social Survey. Wiley. https://doi.org/10.1002/9780470688335