
Surveys · Incentives and engagement
Gamification of Surveys: Engagement Gains and Measurement Risks
Gamified surveys add game elements such as points, progress levels, stories and interactive tasks to keep respondents engaged. This article reviews what the evidence shows about their effects on engagement and data quality, and the risks they pose for measurement.
Online surveys compete for attention with games, videos and social media. Long grids of radio buttons can feel tedious, and bored respondents may speed, straightline or abandon the questionnaire. One response has been gamification: the use of game design elements in non-game contexts (Deterding et al., 2011). In survey research, gamification ranges from small changes, such as a progress bar presented as a journey, to questionnaires rebuilt as interactive stories or challenges. Market research agencies in particular have promoted gamified surveys as a way to improve respondent engagement (Bailey et al., 2015).
The appeal is clear, but gamification also changes how questions are presented, and in survey research presentation affects answers. This article reviews the evidence on whether gamification improves engagement and data quality, and on the measurement risks it introduces.
Why engagement matters
The case for gamification rests on a well-established link between respondents' motivation and the quality of their answers. Satisficing theory holds that when motivation is low or the task is hard, respondents take shortcuts: they choose the first acceptable answer, agree with statements, give the same answer to every item in a grid or say "don't know" (Krosnick, 1991). Galesic (2006) found that respondents who reported less interest and more burden while answering a web survey were more likely to break off, and that interest declined as the questionnaire went on. If game elements raise interest and reduce felt burden, they should, in principle, reduce satisficing and breakoff. The question is whether they do so in practice, and at what cost to measurement.
What gamification looks like
Figure 1 shows six game elements commonly used in surveys.
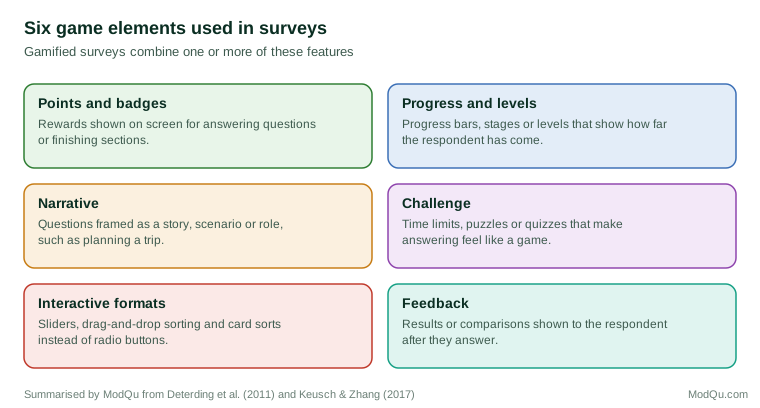
Some elements change only the experience around the questions, such as badges awarded for completing a section. Others change the questions themselves. A question asking how many brands of soft drink the respondent can name may become a timed challenge: "You have one minute to name as many brands as you can." A question about holiday preferences may be framed as a scenario: "Imagine you have won a trip and must pack a suitcase." Answer formats may move from radio buttons to sliders, drag-and-drop tasks or card sorts. Keusch and Zhang (2017) distinguished these "hard" forms of gamification, which add game mechanics such as points and levels, from "soft" forms, which make the questionnaire more playful through wording, design and interactivity.
Effects on engagement
Reviews of gamification in many fields have found generally positive but mixed effects on motivation and engagement, depending on the context and the people involved (Hamari et al., 2014). In surveys, respondents often report enjoying gamified questionnaires more than standard ones, and some studies find longer and richer answers to open questions. Cechanowicz et al. (2013) compared levels of gamification in a market research survey and found that more gamified versions increased participants' engagement and willingness to take part again. Harms et al. (2015) designed and tested a gamified survey and found higher enjoyment than with a conventional version, although completion took longer.
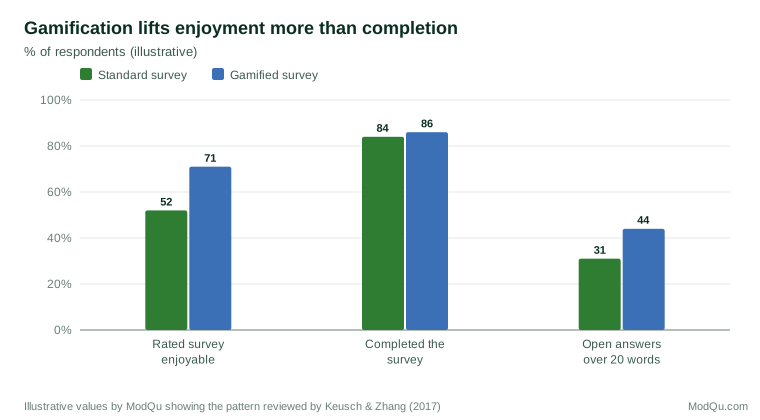
Effects on completion and response rates are smaller and less consistent. Mavletova (2015) tested a gamified longitudinal web survey among children and adolescents and found that gamification increased reported enjoyment and reduced the perceived length of the survey, but had little effect on completion or on later participation. Downes-Le Guin et al. (2012) compared a standard questionnaire with versions using rich visual design and game elements and found that the gamified versions did not improve completion or data quality; some respondents took longer and more broke off. Figure 2 illustrates the typical pattern of results.
Effects on data quality
Supporters argue that engaged respondents give more thoughtful answers. Some evidence supports this for open-ended questions, where gamified framing has produced longer and more detailed answers. For closed questions, the evidence is weaker. Keusch and Zhang (2017), in a review of studies of gamified surveys, concluded that gamification often improved respondents' enjoyment but that effects on data quality indicators, such as straightlining and item nonresponse, were small and inconsistent.
There is also a risk that game elements reduce quality. Time limits encourage quick rather than careful answers. Points awarded per question may reward speed. Elaborate graphics can slow loading on mobile devices and increase breakoffs, especially for respondents with slower connections (Downes-Le Guin et al., 2012).
Gamification on smartphones
A growing share of online surveys is completed on smartphones, and this changes what gamification can do. Interactive elements designed for a computer screen, such as drag-and-drop tasks across a wide grid, may be awkward or impossible on a small touch screen. Mavletova (2013) found that respondents using mobile devices took longer to complete web surveys and broke off more often than those using computers, even with simple designs. Heavy graphics and animations add to loading times and data use. On the other hand, some touch-based formats, such as swiping cards left or right to indicate preference, are natural on smartphones and can make short tasks quicker. Any gamified design should be tested on the devices respondents actually use.
Measurement risks
The more important concern is that gamification changes the measurement itself. Survey methodologists have shown that visual and verbal features of questions affect answers (Tourangeau et al., 2013). Gamification changes many such features at once.
Framing. A scenario or story changes the context in which a question is answered. Asking respondents to imagine themselves as a company director before rating a product may produce different answers from asking them as consumers. The difference may be desirable if the scenario is the intended context, but it makes results hard to compare with those from standard questions.
Answer formats. Sliders, drag-and-drop tasks and visual scales are not equivalent to radio buttons. Funke et al. (2011) found that sliders produced more missing data and longer response times than radio buttons, particularly among respondents with less education. Visual analogue scales and other graphic formats can shift the distribution of answers.
Feedback. Showing respondents their results or comparing them with others' answers can change answers to later questions, as respondents adjust towards what they have seen.
Selection. Respondents differ in how much they enjoy games. If gamified surveys appeal more to some groups, such as younger people, they may change who completes the survey, not only how. Mavletova (2015) noted that the appeal of game elements varied by age.
Comparability. Data from a gamified survey may not be comparable with data from earlier standard surveys, which matters for tracking studies and benchmarks.
Progress indicators: a cautionary example
Progress indicators are one of the simplest game-like features and have been studied extensively. They are intended to encourage completion by showing respondents how far they have come. A meta-analysis by Villar et al. (2013) found that standard progress indicators did not reduce breakoffs on average, that indicators showing fast early progress reduced breakoffs and that those showing slow early progress increased them. Conrad et al. (2010) reached similar conclusions. The lesson is that features intended to motivate respondents can backfire, and that their effects need to be tested rather than assumed.
Using gamification responsibly
The evidence suggests a cautious approach:
- Start with good design. A short, clear questionnaire is the most effective way to keep respondents engaged (Galesic & Bosnjak, 2009). Gamification cannot rescue a survey that is too long.
- Use light-touch elements. Engaging wording, clear progress information and well-designed interactive formats can improve the experience without changing measurement much.
- Avoid game elements on key measures. Use standard formats for questions that will be compared over time or with other surveys.
- Test before use. Compare gamified and standard versions experimentally, checking both engagement and the distribution of answers.
- Check mobile performance. Ensure that graphics and interactive features work on small screens and slow connections.
- Consider the audience. Game elements may suit younger audiences or exploratory research better than surveys of professionals.
An example
A food company tests a gamified version of its quarterly brand survey. Half of a panel sample receives the standard questionnaire; the other half receives a version in which the brand-awareness question becomes a one-minute challenge and the attribute ratings become a card sort. Respondents rate the gamified version as more enjoyable, and completion is similar. However, the challenge format produces higher unprompted awareness for well-known brands and lower awareness for smaller ones, and the card sort compresses differences between brands. The company keeps the enjoyable introduction and progress design but returns to the standard formats for the tracked measures (illustrative example).
Conclusion
Gamification can make surveys more enjoyable and can encourage fuller answers to open questions. Its effects on completion and on the quality of closed-question data are smaller and less consistent than its advocates have claimed, and some features, such as time limits and elaborate graphics, can harm quality. Because game elements change the context and format of questions, they also change measurement, which limits comparability with standard surveys. Used selectively, tested experimentally and kept away from key measures, gamification can be a useful addition to survey design, but it is not a substitute for short, clear and well-designed questionnaires.
References
Bailey, P., Pritchard, G., & Kernohan, H. (2015). Gamification in market research. International Journal of Market Research, 57(1), 17–28. https://doi.org/10.2501/IJMR-2015-003
Cechanowicz, J., Gutwin, C., Brownell, B., & Goodfellow, L. (2013). Effects of gamification on participation and data quality in a real-world market research domain. In Proceedings of the First International Conference on Gameful Design, Research, and Applications (pp. 58–65). ACM. https://doi.org/10.1145/2583008.2583016
Conrad, F. G., Couper, M. P., Tourangeau, R., & Peytchev, A. (2010). The impact of progress indicators on task completion. Interacting with Computers, 22(5), 417–427. https://doi.org/10.1016/j.intcom.2010.03.001
Deterding, S., Dixon, D., Khaled, R., & Nacke, L. (2011). From game design elements to gamefulness: Defining "gamification". In Proceedings of the 15th International Academic MindTrek Conference (pp. 9–15). ACM. https://doi.org/10.1145/2181037.2181040
Downes-Le Guin, T., Baker, R., Mechling, J., & Ruyle, E. (2012). Myths and realities of respondent engagement in online surveys. International Journal of Market Research, 54(5), 613–633. https://doi.org/10.2501/IJMR-54-5-613-633
Funke, F., Reips, U.-D., & Thomas, R. K. (2011). Sliders for the smart: Type of rating scale on the web interacts with educational level. Social Science Computer Review, 29(2), 221–231. https://doi.org/10.1177/0894439310376896
Galesic, M., & Bosnjak, M. (2009). Effects of questionnaire length on participation and indicators of response quality in a web survey. Public Opinion Quarterly, 73(2), 349–360. https://doi.org/10.1093/poq/nfp031
Galesic, M. (2006). Dropouts on the web: Effects of interest and burden experienced during an online survey. Journal of Official Statistics, 22(2), 313–328.
Hamari, J., Koivisto, J., & Sarsa, H. (2014). Does gamification work? A literature review of empirical studies on gamification. In Proceedings of the 47th Hawaii International Conference on System Sciences (pp. 3025–3034). IEEE. https://doi.org/10.1109/HICSS.2014.377
Harms, J., Biegler, S., Wimmer, C., Kappel, K., & Grechenig, T. (2015). Gamification of online surveys: Design process, case study, and evaluation. In J. Abascal, S. Barbosa, M. Fetter, T. Gross, P. Palanque, & M. Winckler (Eds.), Human-computer interaction – INTERACT 2015 (pp. 219–236). Springer. https://doi.org/10.1007/978-3-319-22701-6_16
Keusch, F., & Zhang, C. (2017). A review of issues in gamified surveys. Social Science Computer Review, 35(2), 147–166. https://doi.org/10.1177/0894439315608451
Krosnick, J. A. (1991). Response strategies for coping with the cognitive demands of attitude measures in surveys. Applied Cognitive Psychology, 5(3), 213–236. https://doi.org/10.1002/acp.2350050305
Mavletova, A. (2013). Data quality in PC and mobile web surveys. Social Science Computer Review, 31(6), 725–743. https://doi.org/10.1177/0894439313485201
Mavletova, A. (2015). A gamification effect in longitudinal web surveys among children and adolescents. International Journal of Market Research, 57(3), 413–438. https://doi.org/10.2501/IJMR-2015-035
Tourangeau, R., Conrad, F. G., & Couper, M. P. (2013). The science of web surveys. Oxford University Press. https://doi.org/10.1093/acprof:oso/9780199747047.001.0001
Villar, A., Callegaro, M., & Yang, Y. (2013). Where am I? A meta-analysis of experiments on the effects of progress indicators for web surveys. Social Science Computer Review, 31(6), 744–762. https://doi.org/10.1177/0894439313497468