
Surveys · Questionnaire design
Anchoring Vignettes in Survey Research: Correcting Differential Item Functioning for Better Knowledge
When different groups use the same answer scale in different ways, their answers cannot be compared directly. This article explains the problem of differential item functioning, how anchoring vignettes measure and correct it, the assumptions the method depends on and how to design and analyse vignette questions.
Suppose two people both describe their health as "good". One is an athlete with a minor knee injury; the other has a chronic illness but compares themselves with friends who are much sicker. Their answers are the same, but they mean different things, because the two people use the answer scale differently. Now suppose this happens systematically: people in one country, age group or social class tend to set a higher standard for "good" than people in another. Comparisons between those groups will then be distorted, not because their health differs as reported, but because their use of the scale differs.
This problem is known as differential item functioning, and it affects any survey question that asks people to rate themselves on a subjective scale: health, life satisfaction, political efficacy, job quality, customer satisfaction. Anchoring vignettes are a method designed to measure and correct it. This article explains the problem, how vignettes address it, the assumptions on which the method depends and how to design and analyse vignette questions.
The problem: incomparable answers
Differential item functioning
The term differential item functioning (DIF) comes from educational testing, where it describes a test item that performs differently for different groups of people with the same underlying ability (Holland & Wainer, 1993). In survey research, the equivalent problem arises when respondents with the same true level of a characteristic choose different answer categories because they interpret or use the scale differently. Researchers also describe it as response category DIF, reporting heterogeneity or interpersonal incomparability (King et al., 2004).
DIF is a particular concern in cross-cultural and cross-national research, where groups differ in language, norms and expectations. A long tradition of work on measurement equivalence across groups has shown that comparisons of survey scores are valid only if the measures function in the same way for each group (Vandenberg & Lance, 2000). Cross-cultural survey methodology has developed many techniques for checking this, from careful translation to statistical tests of equivalence (Harkness et al., 2003).
A famous example
The problem is not only theoretical. Sen (2002) pointed out a striking pattern in India: the state of Kerala, which had the highest life expectancy and the best health services in the country, also had the highest rates of self-reported illness, while Bihar, with much worse health, reported the lowest. Similar contrasts appeared between the United States and India. Sen argued that people's perceptions of illness depend on their knowledge and expectations: people with better education and access to health care recognise and report more illness. Self-reports alone could therefore give a completely misleading picture of health differences.
Why ordinary methods cannot fix it
Standard survey methods cannot detect DIF from self-reports alone. If one group gives lower ratings than another, the difference could reflect a real difference in the characteristic or a difference in scale use, and the data provide no way of telling which. Response styles, such as a tendency to choose extreme categories or to agree with statements, raise a related problem and differ systematically between countries (Baumgartner & Steenkamp, 2001). Something external to the self-reports is needed to separate real differences from differences in how the scale is used.
Where differences in scale use come from
Differences in scale use arise at several points in the process of answering a question. Respondents must interpret the meaning of the question and the answer categories, retrieve relevant information, form a judgement and map that judgement onto the categories offered (Tourangeau et al., 2000). At the judgement stage, people compare themselves with a standard, such as their friends, their own past or what they think is normal for their age. At the mapping stage, they decide what "good" or "satisfied" means. Both the standard and the meaning of the labels can differ between groups.
Culture also shapes general tendencies in how people answer. Analyses of surveys in many countries have found that cultural values are associated with the use of extreme categories and with agreement tendencies (Johnson et al., 2005). Reviews of response styles conclude that they are partly stable characteristics of individuals and groups and can seriously bias comparisons if they are ignored (Van Vaerenbergh & Thomas, 2013). Anchoring vignettes address the part of this problem that concerns how respondents map their judgements onto the answer categories.
The solution: anchoring vignettes
What a vignette is
An anchoring vignette is a short description of a hypothetical person whose level of the characteristic is fixed by the description. For a question about mobility, for example, a vignette might read:
"Paul has no problems with walking, running or using his hands, arms and legs. He jogs 4 km twice a week."
Another might describe someone who can walk only short distances with difficulty, and another someone who cannot walk at all. Respondents are asked to rate each vignette person using exactly the same question and answer scale they used to rate themselves: "How much difficulty does Paul have with moving around? None, mild, moderate, severe or extreme?"
How vignettes measure scale use
Because the vignettes describe the same hypothetical people for every respondent, any difference in how respondents rate them must reflect differences in how they use the scale, not differences in the people being rated. If respondents in one country rate Paul as having "mild" difficulty while respondents in another rate him as having "none", the two groups are using the categories differently. The vignettes act as anchors: fixed reference points against which each respondent's use of the scale can be measured (King et al., 2004).
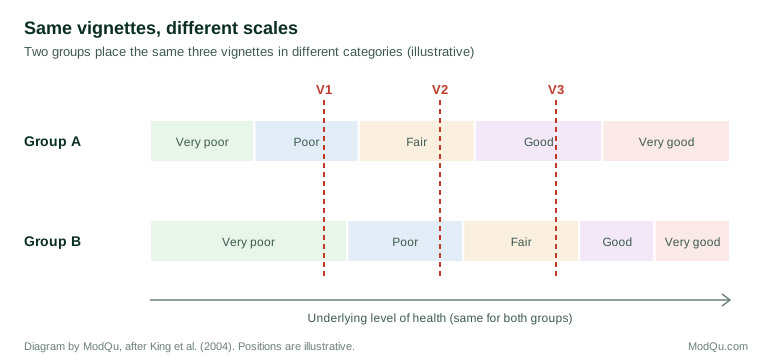
Once each respondent's or group's scale use has been estimated from the vignettes, their self-assessments can be placed on a common scale. In the simplest terms, a respondent's self-rating is interpreted relative to their own ratings of the vignettes: someone who rates themselves as healthier than all three vignette people is in a better position than someone who rates themselves between the first and second, whatever labels they used.
Two key assumptions
The method depends on two assumptions, which King and colleagues set out explicitly (King et al., 2004).
Response consistency
Response consistency means that each respondent uses the answer categories in the same way when rating the vignettes as when rating themselves. If respondents apply a stricter standard to hypothetical people than to themselves, or vice versa, the vignettes do not reveal how they use the scale for self-assessment.
Vignette equivalence
Vignette equivalence means that all respondents understand the vignettes as describing the same level of the characteristic, apart from random error. The method assumes that everyone sees Paul as having the same objective mobility, differing only in which word they use to describe it. If respondents in different groups imagine Paul differently, for example because jogging means something different in their culture, the vignettes no longer provide a common anchor.
Both assumptions can be tested to some extent, and they are the main focus of research on the validity of the method.
Analysing vignette data
Nonparametric methods
The simplest approach recodes each respondent's self-assessment relative to their own vignette ratings. With three vignettes, a respondent's self-rating can be classified as below the first vignette, equal to it, between the first and second and so on, giving a new ordered variable that is comparable across respondents. This method requires no statistical model but needs every respondent to answer the vignettes, and it must deal with respondents who rate the vignettes in an inconsistent order or tie them (King et al., 2004; King & Wand, 2007). Later work extended these nonparametric approaches to produce credible comparisons with fewer assumptions (Wand, 2013).
Parametric methods
The more common approach uses a statistical model, usually an extension of the ordered probit model in which the thresholds between answer categories are allowed to vary with respondents' characteristics. The vignette ratings identify how the thresholds vary, and the self-assessments, interpreted through those thresholds, estimate the underlying level of the characteristic. This model, often called the compound hierarchical ordered probit or CHOPIT model, allows vignettes to be asked of only a subsample of respondents and can be used with explanatory variables (King et al., 2004). Software is available to fit both kinds of model (Wand et al., 2011). Statisticians have examined the conditions under which such models with varying thresholds are identified (Peracchi & Rossetti, 2013).
Applications
Health
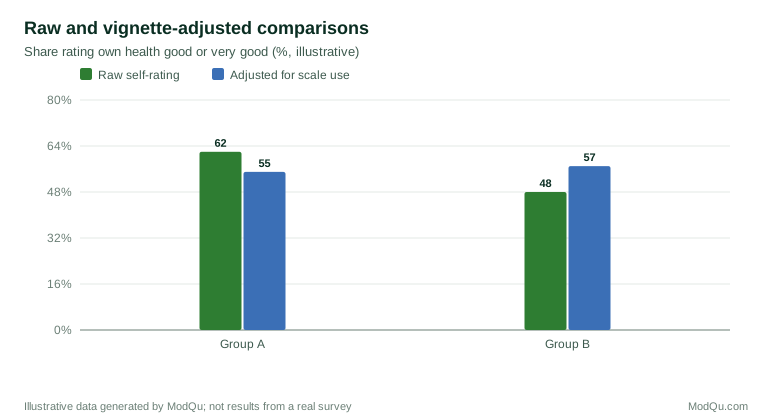
Anchoring vignettes were developed largely for health measurement, and the World Health Organization used them in large multi-country surveys. Analyses of self-rated health across countries found that correcting for differences in scale use changed the ranking of countries substantially (Salomon et al., 2004). Studies of health inequalities found that reporting heterogeneity could bias estimates of differences in health by education and income (Bago d'Uva et al., 2008). Research within a single country also found that groups defined by age, sex and education differed in their use of self-rated health scales (Grol-Prokopczyk et al., 2011).
Work disability
A well-known application compared self-reported work disability in the United States and the Netherlands. Dutch respondents reported much higher rates of work-limiting disability than Americans. When the analysis used vignettes to correct for differences in scale use, a large part of the difference disappeared, suggesting that the Dutch applied a lower threshold for describing themselves as limited (Kapteyn et al., 2007).
Job and life satisfaction
Vignettes have also been used to compare job satisfaction across countries. One study found that differences in the use of the scale accounted for part of the apparent differences between countries, and that correcting for them changed the ranking (Kristensen & Johansson, 2008). Studies of life satisfaction among older Europeans have found similar effects (Angelini et al., 2012).
Politics
The method was introduced in political science with an example comparing political efficacy, the sense of having a say in government, in China and Mexico. Raw self-assessments suggested that Chinese respondents felt more efficacious than Mexicans, which seemed implausible. After correction with vignettes, the ranking reversed, with Mexicans reporting more efficacy (King et al., 2004).
Testing the assumptions
Because the method depends on its assumptions, much research has tried to test them.
Testing response consistency
Response consistency can be tested when an objective measure of the characteristic is available. If respondents' self-assessments, corrected using the vignettes, agree better with objective measures than uncorrected self-assessments do, the vignettes are doing their job. One study compared self-reports of drinking behaviour, corrected with vignettes, with objective information, and found support for response consistency (van Soest et al., 2011). Others, comparing self-rated health with objective health measures, found that the assumption did not always hold (Bago d'Uva et al., 2011).
Testing vignette equivalence
Vignette equivalence can be tested by checking whether respondents' ratings of vignettes are consistent with a common ordering. If most respondents in all groups rank the vignettes in the same order, this supports the assumption that they understand them similarly. Research has also tested whether characteristics of the vignette person, such as age and sex, affect ratings, and found that they sometimes do, which means vignettes should be designed carefully (Jürges & Winter, 2013). Analyses of the consistency of vignette ratings found substantial numbers of respondents who ordered vignettes differently from the intended order (Au & Lorgelly, 2014).
The overall picture
The evidence suggests that vignettes can improve comparability but are not a guaranteed fix. They work best when the vignettes are well designed and when the assumptions are checked in the data. Some researchers have urged caution about relying on vignette corrections without such checks (Grol-Prokopczyk et al., 2011).
Designing anchoring vignettes
Good vignette design is essential, because the method depends on vignettes that respondents understand in the same way. Research and practice suggest several principles (Hopkins & King, 2010; King & Wand, 2007).
Describe one dimension clearly
Each vignette should describe the characteristic being measured, and only that. If a vignette about mobility also mentions pain or mood, respondents may rate it on those features. Descriptions should be concrete, using observable behaviour such as "walks 200 metres before needing to rest", rather than vague terms that respondents might interpret differently.
Cover the range of the scale
Vignettes should describe people at different levels, so that they fall into different answer categories and anchor different parts of the scale. Vignettes that all fall in the middle provide little information about how respondents use the extremes.
Use enough vignettes, but not too many
Two to five vignettes per question are common. More vignettes give more information about scale use but add to respondent burden, especially when vignettes are used for several questions.
Keep the vignette person neutral
Names, ages and sexes of vignette people can affect ratings. Using names and characteristics that are common in all groups being compared, or varying them systematically, reduces the risk that the vignette person's identity influences ratings (Jürges & Winter, 2013).
Consider the order of questions
Asking the vignette questions before the self-assessment may help respondents understand the scale and improve comparability, as experiments have suggested (Hopkins & King, 2010). Asking self-assessments first, however, ensures that self-ratings are not influenced by the vignettes. The choice should be consistent across groups being compared.
Translate with care
In cross-national surveys, vignettes must be translated so that they describe the same level of the characteristic in every language and culture. This is harder than translating a simple question, because activities, foods and social situations mentioned in a vignette may have different meanings in different places (Harkness et al., 2003).
Pretest the vignettes
Cognitive interviews and pilot tests can show whether respondents understand the vignettes as intended and rank them in the expected order. Vignettes that many respondents rank inconsistently should be revised or dropped.
An example of a vignette set
To illustrate the design principles, consider a survey that compares employees' sense of workload across offices in several countries. The self-assessment question asks: "How would you describe your workload? Very light, light, about right, heavy or very heavy?" A set of three vignettes might read:
"Anna usually finishes her work within her normal hours and rarely needs to work in the evening."
"Maria works about two extra hours a week to finish her tasks and occasionally checks email at weekends."
"Sara regularly works late into the evening and at weekends and often cannot finish her tasks on time."
Each vignette describes only workload, uses concrete behaviour and represents a clearly different level. The names are common in all the countries concerned, and the vignette people are all the same sex to avoid sex affecting ratings. In a pretest, respondents would be asked to rate each vignette using the same question, and analysts would check that most respondents rank Anna below Maria and Maria below Sara. If they do, differences between offices in how the vignettes are rated show how each office uses the workload scale (illustrative example).
Vignettes in business and market research
Although anchoring vignettes come from academic research, the problem they address is common in business surveys. International companies compare customer satisfaction, employee engagement and brand perceptions across countries, and the countries often differ in how they use rating scales. Customers in some markets rarely give the top score, while those in others give it readily. Differences in raw scores may therefore reflect scale use rather than real differences in satisfaction (Baumgartner & Steenkamp, 2001).
Vignettes offer a way to separate the two. A customer satisfaction survey could include short descriptions of hypothetical service experiences, such as a delivery that arrived one day late with no explanation, and ask customers in each country to rate them. If ratings of the same experiences differ between countries, the differences reveal how each market uses the scale, and this information can be used to adjust comparisons. The cost is a few extra questions, which may be well worth it when important decisions depend on cross-market comparisons.
Limitations
Anchoring vignettes have several limitations. They add questions to the survey, increasing burden. Their validity depends on assumptions that may not hold, and testing those assumptions requires additional data. Designing good vignettes requires careful development and pretesting, especially across languages. The statistical models are more complex than standard analyses and require specialist software. Finally, vignettes correct for differences in scale use but not for other sources of error, such as differences in what respondents remember or are willing to report (Groves et al., 2009).
Conclusion
When people use rating scales in different ways, comparisons of their answers can be misleading, sometimes dramatically. Anchoring vignettes provide a way to measure how different respondents and groups use a scale and to correct for those differences, by asking everyone to rate the same hypothetical people. The method has changed conclusions about health, disability, satisfaction and political attitudes across countries and groups. It works best when vignettes are carefully designed, when its assumptions of response consistency and vignette equivalence are tested and when results are interpreted with an understanding of what the corrections can and cannot do. For anyone comparing subjective ratings across groups, vignettes offer a practical way to produce knowledge that is more comparable and more trustworthy.
References
Angelini, V., Cavapozzi, D., Corazzini, L., & Paccagnella, O. (2012). Age, health and life satisfaction among older Europeans. Social Indicators Research, 105(2), 293–308. https://doi.org/10.1007/s11205-011-9882-x
Au, N., & Lorgelly, P. K. (2014). Anchoring vignettes for health comparisons: An analysis of response consistency. Quality of Life Research, 23(6), 1721–1731. https://doi.org/10.1007/s11136-013-0615-2
Bago d'Uva, T., Lindeboom, M., O'Donnell, O., & van Doorslaer, E. (2011). Slipping anchor? Testing the vignettes approach to identification and correction of reporting heterogeneity. Journal of Human Resources, 46(4), 875–906. https://doi.org/10.3368/jhr.46.4.875
Bago d'Uva, T., van Doorslaer, E., Lindeboom, M., & O'Donnell, O. (2008). Does reporting heterogeneity bias the measurement of health disparities? Health Economics, 17(3), 351–375. https://doi.org/10.1002/hec.1269
Baumgartner, H., & Steenkamp, J.-B. E. M. (2001). Response styles in marketing research: A cross-national investigation. Journal of Marketing Research, 38(2), 143–156. https://doi.org/10.1509/jmkr.38.2.143.18840
Grol-Prokopczyk, H., Freese, J., & Hauser, R. M. (2011). Using anchoring vignettes to assess group differences in general self-rated health. Journal of Health and Social Behavior, 52(2), 246–261. https://doi.org/10.1177/0022146510396713
Groves, R. M., Fowler, F. J., Jr., Couper, M. P., Lepkowski, J. M., Singer, E., & Tourangeau, R. (2009). Survey methodology (2nd ed.). Wiley.
Harkness, J. A., van de Vijver, F. J. R., & Mohler, P. Ph. (Eds.). (2003). Cross-cultural survey methods. Wiley.
Holland, P. W., & Wainer, H. (Eds.). (1993). Differential item functioning. Lawrence Erlbaum.
Hopkins, D. J., & King, G. (2010). Improving anchoring vignettes: Designing surveys to correct interpersonal incomparability. Public Opinion Quarterly, 74(2), 201–222. https://doi.org/10.1093/poq/nfq011
Johnson, T., Kulesa, P., Cho, Y. I., & Shavitt, S. (2005). The relation between culture and response styles: Evidence from 19 countries. Journal of Cross-Cultural Psychology, 36(2), 264–277. https://doi.org/10.1177/0022022104272905
Jürges, H., & Winter, J. (2013). Are anchoring vignettes ratings sensitive to vignette age and sex? Health Economics, 22(1), 1–13. https://doi.org/10.1002/hec.1806
Kapteyn, A., Smith, J. P., & van Soest, A. (2007). Vignettes and self-reports of work disability in the United States and the Netherlands. American Economic Review, 97(1), 461–473. https://doi.org/10.1257/aer.97.1.461
King, G., & Wand, J. (2007). Comparing incomparable survey responses: Evaluating and selecting anchoring vignettes. Political Analysis, 15(1), 46–66. https://doi.org/10.1093/pan/mpl011
King, G., Murray, C. J. L., Salomon, J. A., & Tandon, A. (2004). Enhancing the validity and cross-cultural comparability of measurement in survey research. American Political Science Review, 98(1), 191–207. https://doi.org/10.1017/S000305540400108X
Kristensen, N., & Johansson, E. (2008). New evidence on cross-country differences in job satisfaction using anchoring vignettes. Labour Economics, 15(1), 96–117. https://doi.org/10.1016/j.labeco.2006.11.001
Peracchi, F., & Rossetti, C. (2013). The heterogeneous thresholds ordered response model: Identification and inference. Journal of the Royal Statistical Society: Series A (Statistics in Society), 176(3), 703–722.
Salomon, J. A., Tandon, A., & Murray, C. J. L. (2004). Comparability of self rated health: Cross sectional multi-country survey using anchoring vignettes. BMJ, 328(7434), 258. https://doi.org/10.1136/bmj.37963.691632.44
Sen, A. (2002). Health: Perception versus observation. BMJ, 324(7342), 860–861. https://doi.org/10.1136/bmj.324.7342.860
Tourangeau, R., Rips, L. J., & Rasinski, K. (2000). The psychology of survey response. Cambridge University Press. https://doi.org/10.1017/CBO9780511819322
van Soest, A., Delaney, L., Harmon, C., Kapteyn, A., & Smith, J. P. (2011). Validating the use of anchoring vignettes for the correction of response scale differences in subjective questions. Journal of the Royal Statistical Society: Series A (Statistics in Society), 174(3), 575–595. https://doi.org/10.1111/j.1467-985X.2011.00694.x
Van Vaerenbergh, Y., & Thomas, T. D. (2013). Response styles in survey research: A literature review of antecedents, consequences, and remedies. International Journal of Public Opinion Research, 25(2), 195–217. https://doi.org/10.1093/ijpor/eds021
Vandenberg, R. J., & Lance, C. E. (2000). A review and synthesis of the measurement invariance literature: Suggestions, practices, and recommendations for organizational research. Organizational Research Methods, 3(1), 4–70. https://doi.org/10.1177/109442810031002
Wand, J. (2013). Credible comparisons using interpersonally incomparable data: Nonparametric scales with anchoring vignettes. American Journal of Political Science, 57(1), 249–262. https://doi.org/10.1111/j.1540-5907.2012.00597.x
Wand, J., King, G., & Lau, O. (2011). anchors: Software for anchoring vignette data. Journal of Statistical Software, 42(3), 1–25. https://doi.org/10.18637/jss.v042.i03