
Research · Communicating research
Writing a Research Report That Decision-Makers Will Read
How decision-makers read research, what the evidence says about formats that help them, and a practical structure for reports that lead with the answer, show the evidence and state uncertainty plainly.
Most research reports are written in the order the research was done: background, methods, results, discussion and, at the end, conclusions. That order suits other researchers, who want to judge how a finding was produced before they accept it. It suits decision-makers poorly. A manager, client or public official usually wants to know what the research found, what it means for the decision in front of them and how far it can be trusted, and they want to know this in the first few minutes of reading. This article sets out what is known about how decision-makers use research and describes a report structure designed around their needs.
How decision-makers use research
Research rarely moves straight from a report into a decision. Weiss (1979) described several ways in which research is used. In the problem-solving model, a study is commissioned to answer a specific question and its answer shapes the choice. In the enlightenment model, research changes how people think about an issue gradually, through concepts and findings that spread over time. In the political model, research is used to support a position that has already been taken. A report writer cannot control which of these applies, but a report that answers a clear question in plain terms is more useful in all of them.
Decision-makers also judge research on more than its quality. Weiss and Bucuvalas (1980) asked 155 decision-makers in mental health-related positions to respond to 50 research reports. They found that readers applied two tests. A truth test asked whether the research was sound and whether it fitted with what they already knew. A utility test asked whether it offered a practical direction for action or a useful challenge to current policy. A report that passes the first test but not the second is likely to be filed and forgotten.
Systematic reviews of the evidence point the same way. Innvær et al. (2002) reviewed interview studies of health policy-makers and found that personal contact with researchers, timeliness and relevance were the factors most often reported as helping research to be used, while lack of these were among the most common barriers. Oliver et al. (2014) updated this work with 145 further studies and found that the most frequently reported barriers were poor access to good-quality, relevant research and a lack of timely research output. The report itself is only one part of the picture, but it is the part the researcher controls most directly.
Graded entry: the 1:3:25 format
Lavis et al. (2005) interviewed managers and policy-makers in Canada and the United Kingdom about systematic reviews. They concluded that these readers would benefit from a format that let them scan quickly for relevance and then read in more depth if needed, which they called graded entry. Their example was a one-page set of take-home messages, a three-page executive summary and a 25-page report. The same structure had been promoted by the Canadian Health Services Research Foundation (2001) as the "1:3:25" format for research written for decision-makers.
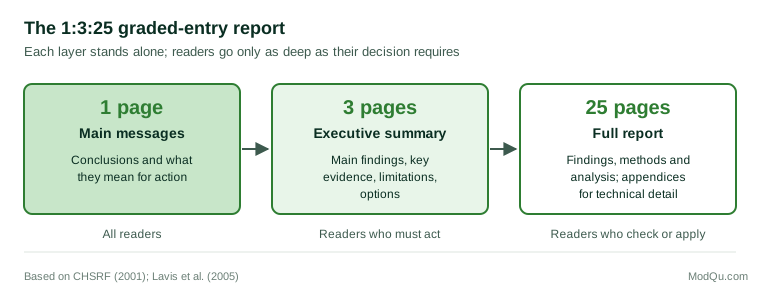
Each layer has a different job:
- One page of main messages. The conclusions, stated as plainly as possible, with what they imply for action. This page is not a summary of the report's sections; it states what the reader should take away.
- A three-page executive summary. The main findings with enough supporting evidence for a reader to accept them, the key limitations, and the options or recommendations.
- A report of about 25 pages. The full findings, methods and analysis, written for readers who need to check the work or apply it in detail. Technical material that only specialists need goes in appendices.
The format is not a strict rule about page counts. Its value is that each layer can be read on its own. Petkovic et al. (2018) reviewed randomised trials of evidence summaries for health policy-makers. They found that summaries, including graded-entry formats, may be easier to understand and use than full systematic reviews, though the trials did not show whether the summaries changed actual decisions. The evidence supports graded entry as a way to improve comprehension, not as a guarantee of influence.
Lead with the answer
The single most useful change most report writers can make is to put the conclusion first. Minto (2002) set out this approach for business writing as the pyramid principle: start with the main point, then give the arguments that support it, then the evidence that supports each argument. A reader who stops after the first paragraph still has the answer; a reader who continues finds out why.
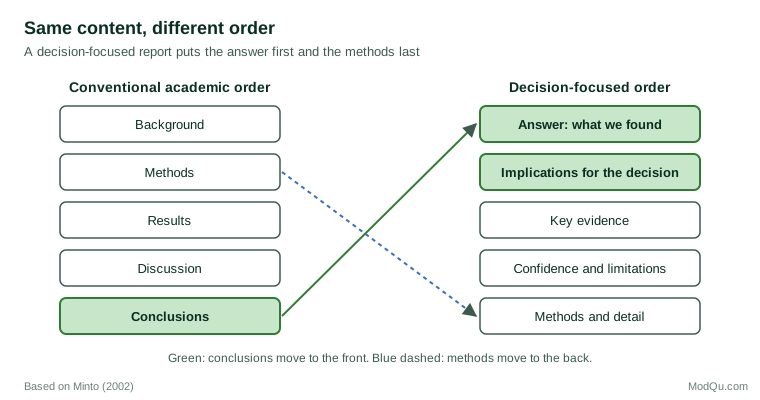
In practice this means the first page should answer four questions:
- What was the question? One sentence that names the decision the research was meant to inform.
- What did we find? The main findings, with the most important numbers.
- What does it mean? The implications for the decision, including options if the research does not point to a single course of action.
- How sure are we? A plain statement of confidence and the main reasons for doubt.
Headings can do much of this work. A heading such as "Results" tells the reader where they are; a heading such as "Customers who used the new service were less likely to cancel" tells them what they will learn. Readers who skim the headings alone should be able to follow the argument.
Make the evidence easy to check
Leading with the answer does not mean hiding the evidence. Decision-makers apply the truth test as well as the utility test (Weiss & Bucuvalas, 1980), and a conclusion that cannot be traced to its evidence will not be trusted for long. Each main message should be linked to the findings that support it, and each finding to the part of the report where the method and data are described.
Numbers need particular care. Gigerenzer et al. (2007) reviewed evidence that many people, including professionals, misread statistics presented in some formats. Relative risks ("a 50% reduction") are often misunderstood without the absolute figures ("from 2 in 100 to 1 in 100"), and natural frequencies are generally easier to follow than conditional probabilities. A good report gives absolute figures alongside relative ones, uses the same denominator throughout, and avoids reporting more decimal places than the data justify.
Charts should show the comparison that matters for the decision and little else. Tufte (2001) argued that the ink in a chart should be spent on the data rather than on decoration, and that charts should allow the reader to make comparisons directly. A chart title that states the finding ("Cancellations fell in all regions after the change") is more useful to a busy reader than one that only names the variables.
State uncertainty plainly
Report writers often worry that admitting uncertainty will make the findings look weak. The evidence suggests the cost is small. In a series of experiments with 5,780 participants, van der Bles et al. (2020) found that communicating uncertainty led to only a small decrease in trust in the number and in the trustworthiness of its source. The decrease was mostly seen when uncertainty was expressed in words rather than as a numerical range. Spiegelhalter (2017) reviews research on communicating uncertainty in numbers, words and graphics, and recommends being clear about the purpose of the communication and working closely with the intended audience.
Uncertainty should be stated in terms of the decision. "The sample was small" is less helpful than "the true effect could be anywhere from a small loss to a moderate gain, so a pilot in one region would reduce the risk before a national roll-out". The second version tells the reader what the uncertainty means for what they should do.
Write in plain language
Plain language is not simplification of the findings. It is the removal of obstacles between the reader and the findings. Oppenheimer (2006) found in a series of experiments that texts using needlessly complex vocabulary led readers to judge their authors as less intelligent, not more. Short sentences, familiar words, active verbs and defined terms all help.
Technical terms should be used where they carry meaning that a plainer word would lose, and defined the first time they appear. Jargon from the researcher's own field, such as "statistically significant", "regression coefficient" or "saturation", should be translated into what it means for the reader: "too large to be explained by chance alone", "for each additional year of age, spending rose by about $40", "further interviews were adding no new themes".
Know the audience before writing
Lavis et al. (2003) proposed that anyone transferring research knowledge to decision-makers should ask five questions: what should be transferred, to whom, by whom, how, and with what effect. For a report, the "to whom" question comes first. A board, an operations team and a regulator may need different main messages from the same study.
The audience also affects the form of evidence that persuades. Brownson et al. (2011) sent different versions of a policy brief on mammography screening to state legislators, legislative staff and executive branch administrators in six U.S. states. Staff found a version built around a story with state-level data most useful, while legislators preferred a data-focused version with state-level data. The authors concluded that tailoring the communication to the type of policy-maker may work better than a single format for all.
Cairney and Kwiatkowski (2017) add that decision-makers have limited time and attention and rely on shortcuts to process information. They advise against overwhelming readers with evidence and recommend framing findings in ways that connect with what the audience already cares about, and timing communication so that it arrives when a decision is being made.
A checklist before sending
- Does the first page state the question, the answer, the implications and the level of confidence?
- Can each layer of the report be read on its own?
- Do the headings state findings rather than section names?
- Are absolute numbers given alongside relative ones?
- Is each conclusion linked to the evidence that supports it?
- Are the main limitations stated in terms of what they mean for the decision?
- Have methods and technical detail been moved to the back or to appendices, without being removed?
- Would a reader outside the research team understand every term used?
Patton (2008) argues that evaluations should be judged by whether their intended users actually use them. The same standard applies to any research report written for a decision. A report that is accurate but unread has not done its job.
References
Brownson, R. C., Dodson, E. A., Stamatakis, K. A., Casey, C. M., Elliott, M. B., Luke, D. A., Wintrode, C. G., & Kreuter, M. W. (2011). Communicating evidence-based information on cancer prevention to state-level policy makers. Journal of the National Cancer Institute, 103(4), 306–316. https://doi.org/10.1093/jnci/djq529
Cairney, P., & Kwiatkowski, R. (2017). How to communicate effectively with policymakers: Combine insights from psychology and policy studies. Palgrave Communications, 3, Article 37. https://doi.org/10.1057/s41599-017-0046-8
Canadian Health Services Research Foundation. (2001). Reader-friendly writing – 1:3:25. Canadian Health Services Research Foundation.
Gigerenzer, G., Gaissmaier, W., Kurz-Milcke, E., Schwartz, L. M., & Woloshin, S. (2007). Helping doctors and patients make sense of health statistics. Psychological Science in the Public Interest, 8(2), 53–96. https://doi.org/10.1111/j.1539-6053.2008.00033.x
Innvær, S., Vist, G., Trommald, M., & Oxman, A. (2002). Health policy-makers' perceptions of their use of evidence: A systematic review. Journal of Health Services Research & Policy, 7(4), 239–244. https://doi.org/10.1258/135581902320432778
Lavis, J., Davies, H., Oxman, A., Denis, J.-L., Golden-Biddle, K., & Ferlie, E. (2005). Towards systematic reviews that inform health care management and policy-making. Journal of Health Services Research & Policy, 10(Suppl. 1), 35–48. https://doi.org/10.1258/1355819054308549
Lavis, J. N., Robertson, D., Woodside, J. M., McLeod, C. B., & Abelson, J. (2003). How can research organizations more effectively transfer research knowledge to decision makers? The Milbank Quarterly, 81(2), 221–248. https://doi.org/10.1111/1468-0009.t01-1-00052
Minto, B. (2002). The pyramid principle: Logic in writing and thinking (3rd ed.). Financial Times Prentice Hall.
Oliver, K., Innvar, S., Lorenc, T., Woodman, J., & Thomas, J. (2014). A systematic review of barriers to and facilitators of the use of evidence by policymakers. BMC Health Services Research, 14, Article 2. https://doi.org/10.1186/1472-6963-14-2
Oppenheimer, D. M. (2006). Consequences of erudite vernacular utilized irrespective of necessity: Problems with using long words needlessly. Applied Cognitive Psychology, 20(2), 139–156. https://doi.org/10.1002/acp.1178
Patton, M. Q. (2008). Utilization-focused evaluation (4th ed.). Sage.
Petkovic, J., Welch, V., Jacob, M. H., Yoganathan, M., Ayala, A. P., Cunningham, H., & Tugwell, P. (2018). Do evidence summaries increase health policy-makers' use of evidence from systematic reviews? A systematic review. Campbell Systematic Reviews, 14(1), 1–52. https://doi.org/10.4073/csr.2018.8
Spiegelhalter, D. (2017). Risk and uncertainty communication. Annual Review of Statistics and Its Application, 4, 31–60.
Tufte, E. R. (2001). The visual display of quantitative information (2nd ed.). Graphics Press.
van der Bles, A. M., van der Linden, S., Freeman, A. L. J., & Spiegelhalter, D. J. (2020). The effects of communicating uncertainty on public trust in facts and numbers. Proceedings of the National Academy of Sciences, 117(14), 7672–7683. https://doi.org/10.1073/pnas.1913678117
Weiss, C. H. (1979). The many meanings of research utilization. Public Administration Review, 39(5), 426–431. https://doi.org/10.2307/3109916
Weiss, C. H., & Bucuvalas, M. J. (1980). Truth tests and utility tests: Decision-makers' frames of reference for social science research. American Sociological Review, 45(2), 302–313.