
Research · Communicating research
Research Impact Assessment Frameworks and Metrics
How the impact of research is assessed: the difference between academic and societal impact, the main frameworks and metrics, their limitations, and principles for using them responsibly.
Governments, research funders, universities and companies all spend money on research, and all want to know what they get for it. Research impact assessment is the effort to answer that question systematically. It covers two broad kinds of effect: academic impact, the contribution research makes to knowledge and to other research, and societal impact, the effects it has outside academia, on the economy, health, policy, culture, the environment or quality of life.
Assessing either kind is difficult. Effects can take many years to appear, they usually depend on many studies and many other factors, and some of the most important effects are hard to measure. This article describes the main frameworks used to assess impact, the most common metrics and their limitations, and the principles that have been developed for using metrics responsibly.
Why assess research impact?
Impact assessment serves several purposes, and Penfield et al. (2014) show in their review that the reasons for assessing impact shape the methods chosen. The purposes are often summarised as four: accountability, showing funders and the public that money has been well spent; allocation, informing decisions about where future funds should go; advocacy, making the case for research investment; and analysis, understanding how research produces its effects so that the process can be improved. The purpose affects the method. An assessment intended to allocate funding needs to compare units fairly, while an assessment intended for learning can focus on detailed case studies of how particular effects came about.
Defining impact is itself a choice. Bornmann (2013) reviewed the literature on societal impact and noted that there is no agreed definition, and that the terms used, such as societal benefit, public value and third-stream activity, vary between countries and funders. Most definitions share the idea that impact is a demonstrable change or benefit beyond academia, as distinct from activity such as outreach events, which may or may not lead to change.
The time lag and attribution problems
Two problems run through all impact assessment. The first is time. In health research, Morris et al. (2011) reviewed studies of how long research takes to reach practice and found that the commonly quoted figure of 17 years conceals wide variation depending on the starting and end points chosen. Short assessment windows will miss many effects, while long windows make it harder to link effects to the research that produced them.
The second is attribution. A change in policy or practice usually depends on many studies, on advocacy, on politics and on chance. Claiming that one project caused an outcome is rarely justified. Many frameworks therefore ask for evidence of contribution, showing that the research was one of the factors that made a difference, rather than proof of sole causation (Reed et al., 2021).
Frameworks for assessing societal impact
The Payback Framework
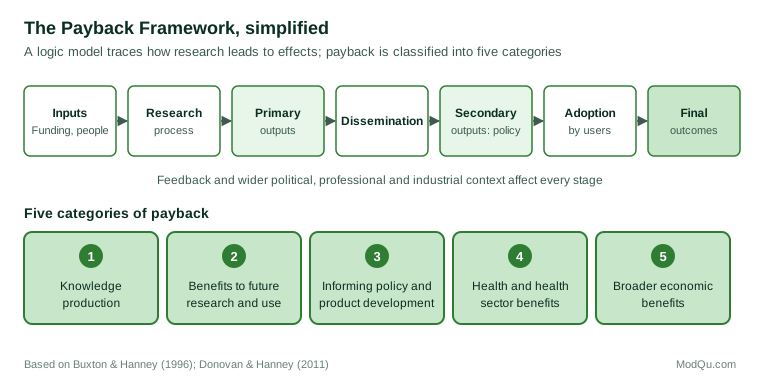
The Payback Framework was developed by Buxton and Hanney (1996) to assess the returns from health services research. It combines a logic model of the research process, from the initial idea through the research itself to its dissemination and use, with a classification of five categories of payback:
- knowledge production, such as publications;
- benefits to future research and research use, such as better targeting of research and capacity building;
- informing policy and product development;
- health and health sector benefits;
- broader economic benefits.
The framework is usually applied through case studies, combining document review, interviews and bibliometric analysis. Donovan and Hanney (2011) note that it has been widely adapted beyond health, and that its strength lies in tracing the pathways by which research produces effects rather than simply counting outputs.
The CAHS framework
In Canada, the Canadian Academy of Health Sciences (2009) built on the Payback Framework to produce a preferred framework for measuring returns on investment in health research. It uses five categories, advancing knowledge, capacity building, informing decision making, health impacts, and broad economic and social impacts, and offers a menu of indicators within each. The framework was designed to be adapted by different organisations according to their missions, rather than applied as a single fixed set of measures.
Logic models and theories of change
Many organisations use a logic model to describe the expected chain from inputs and activities to outputs, outcomes and long-term impact (W. K. Kellogg Foundation, 2004). A theory of change goes further by stating the assumptions that link each step. Both help to decide in advance what evidence should be collected, and both can be used to plan impact as well as assess it. Reed et al. (2021) propose a methodological framework for evaluating impact that starts from the type of impact claimed and the purpose of the evaluation, and then selects methods, such as surveys, interviews, documentary analysis or economic valuation, to match.
National assessment: the UK Research Excellence Framework
The UK's Research Excellence Framework (REF) is the best-known national system that assesses societal impact. Universities submit impact case studies describing specific effects of their research beyond academia, together with evidence. Expert panels, including research users, grade each case on its reach and significance. In REF 2021, impact accounted for 25% of the overall assessment, up from 20% in REF 2014, and institutions submitted 6,781 impact case studies (Research Excellence Framework, 2019; Stevenson et al., 2023).
The case study method allows a wide range of impacts to be described and assessed by people with relevant knowledge. Its weaknesses are cost and selectivity: preparing case studies takes considerable effort, and they show the best examples rather than the typical effect of an institution's research. Stern (2016), in an independent review of the REF, supported keeping impact case studies but recommended changes to broaden the types of impact recognised and to reduce the burden.
Metrics of academic impact
Quantitative indicators based on publications and citations, known as bibliometrics, are the most widely used measures of academic impact. Waltman (2016) reviews the main citation indicators and the technical issues they raise.
Citation counts measure how often a publication has been cited by other publications. They reflect use by other researchers, but citations accumulate at very different rates across fields and over time, so raw counts cannot be compared across disciplines or publication years. Field-normalised indicators address this by comparing each publication's citations with the average for publications of the same field, year and type.
The journal impact factor is the average number of citations received in a given year by the items a journal published in the previous two years. It was designed to help libraries choose journals, not to evaluate individual articles or researchers. Seglen (1997) showed why it is a poor guide to the quality of individual papers: citations within a journal are highly skewed, with a small share of articles receiving most of the citations, so the average says little about any one article. He reported that the most cited half of articles in a journal were cited, on average, about 10 times as often as the least cited half.
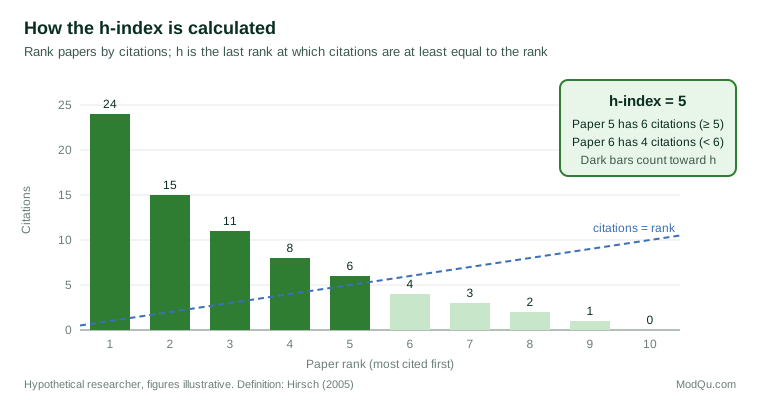
The h-index, proposed by Hirsch (2005), is the largest number h such that a researcher has h publications each cited at least h times. It combines output and citation in a single number, but it depends on career length and field, it cannot decrease, and it ignores the order of authors.
Altmetrics track attention to research in online sources such as social media, blogs and reference managers (Priem et al., 2010), and current services also count mentions in news coverage and policy documents. They appear sooner than citations and can capture interest from outside academia. Thelwall et al. (2013) found that, for several sources, articles with more altmetric mentions tended to have more citations, but the associations were weak or absent for many sources and coverage was low. Mentions in policy documents may say more about societal impact than social media attention, which can reflect novelty or controversy rather than use.
The limits of metrics
Metrics are attractive because they are cheap, quick and appear objective. Their limits are well documented.
- They measure attention, not quality or benefit. A paper may be highly cited because it is wrong and widely disputed, and a study that changed policy may be rarely cited.
- They vary between fields. Citation practices differ greatly; the humanities and many applied fields publish in books and reports that databases cover poorly.
- They can be gamed. When a measure becomes a target, people change their behaviour to improve the measure. Strathern (1997) expressed this as a general principle of audit: when a measure becomes a target, it ceases to be a good measure. Excessive self-citation and dividing work into the smallest publishable units are examples of such behaviour, and Edwards and Roy (2017) describe how incentives tied to publication and citation counts can undermine research integrity.
- They miss most societal impact. Citations count use by researchers; they say little about effects on practice, policy or the public (Bornmann, 2013).
Principles for responsible use
Concern about the misuse of metrics led to several statements of principle.
The San Francisco Declaration on Research Assessment (DORA, 2012) recommends that journal-based metrics such as the impact factor should not be used as a substitute for the quality of individual articles, or to assess individual scientists in hiring, promotion or funding decisions. It asks that research be assessed on its own merits.
The Leiden Manifesto (Hicks et al., 2015) sets out ten principles for research metrics. They include that quantitative evaluation should support, not replace, expert qualitative assessment; that performance should be measured against the mission of the institution, group or researcher; that data and analysis should be open and transparent; that field differences should be accounted for; and that indicators should be scrutinised and updated regularly.
In the UK, The Metric Tide (Wilsdon et al., 2015), an independent review of the role of metrics in research assessment, found that metrics could not replace peer review in the REF and proposed the idea of responsible metrics, based on five dimensions: robustness, humility, transparency, diversity and reflexivity. Humility means recognising that quantitative evaluation should support, but not supplant, expert judgement.
More recently, the Agreement on Reforming Research Assessment, published in 2022 by a coalition of European research organisations, commits signatories to base assessment primarily on qualitative judgement supported by responsible use of quantitative indicators, and to recognise a wider range of contributions, including data sharing, teaching and engagement (Coalition for Advancing Research Assessment, 2022).
Choosing an approach
No single framework or metric captures all forms of impact. Greenhalgh et al. (2016) reviewed impact assessment approaches in health research and concluded that the choice depends on the purpose of the assessment, the type of research and the resources available. Case study methods capture detail and context but are costly; metrics are cheap but narrow; and mixed approaches that combine indicators with narrative evidence are increasingly common.
Some practical guidance follows from the frameworks and principles above:
- Start with the purpose. Accountability, allocation, advocacy and learning call for different evidence.
- Plan for impact early. A logic model or theory of change written at the start of a project shows what evidence to collect along the way, such as records of meetings with users or citations in policy documents.
- Combine indicators with judgement. Use metrics as one input to expert review, never as the only basis for decisions about individuals.
- Normalise for field and time when comparing citation-based indicators.
- Look for contribution, not sole attribution, and describe the other factors involved.
- Allow enough time for effects to appear, and say what may not yet be visible.
- Watch for unintended effects of the assessment itself on researchers' behaviour.
Impact assessment outside academia
Commercial and in-house research teams face the same question in a different form: did the research change decisions, and did those decisions produce value? The academic frameworks translate readily. A logic model can link a research programme to the business decisions it was meant to inform. A simple record of which studies influenced which decisions, kept as studies are completed, provides the case study evidence that is otherwise hard to reconstruct later. Where outcomes can be measured, such as a change in conversion or retention after a research-based change, they provide the strongest evidence of value, provided other influences are acknowledged.
The lesson from two decades of academic experience is that impact assessment works best when it is planned, when it combines numbers with evidence about how effects came about, and when the people being assessed understand and accept the measures used.
References
Bornmann, L. (2013). What is societal impact of research and how can it be assessed? A literature survey. Journal of the American Society for Information Science and Technology, 64(2), 217–233. https://doi.org/10.1002/asi.22803
Buxton, M., & Hanney, S. (1996). How can payback from health services research be assessed? Journal of Health Services Research & Policy, 1(1), 35–43. https://doi.org/10.1177/135581969600100107
Canadian Academy of Health Sciences. (2009). Making an impact: A preferred framework and indicators to measure returns on investment in health research. Canadian Academy of Health Sciences.
Coalition for Advancing Research Assessment. (2022). Agreement on reforming research assessment. https://www.coara.org/agreement/the-agreement-full-text/
DORA. (2012). San Francisco declaration on research assessment. https://sfdora.org/read/
Donovan, C., & Hanney, S. (2011). The 'Payback Framework' explained. Research Evaluation, 20(3), 181–183. https://doi.org/10.3152/095820211X13118583635756
Edwards, M. A., & Roy, S. (2017). Academic research in the 21st century: Maintaining scientific integrity in a climate of perverse incentives and hypercompetition. Environmental Engineering Science, 34(1), 51–61. https://doi.org/10.1089/ees.2016.0223
Greenhalgh, T., Raftery, J., Hanney, S., & Glover, M. (2016). Research impact: A narrative review. BMC Medicine, 14, Article 78. https://doi.org/10.1186/s12916-016-0620-8
Hicks, D., Wouters, P., Waltman, L., de Rijcke, S., & Rafols, I. (2015). Bibliometrics: The Leiden Manifesto for research metrics. Nature, 520(7548), 429–431. https://doi.org/10.1038/520429a
Hirsch, J. E. (2005). An index to quantify an individual's scientific research output. Proceedings of the National Academy of Sciences, 102(46), 16569–16572. https://doi.org/10.1073/pnas.0507655102
Morris, Z. S., Wooding, S., & Grant, J. (2011). The answer is 17 years, what is the question: Understanding time lags in translational research. Journal of the Royal Society of Medicine, 104(12), 510–520. https://doi.org/10.1258/jrsm.2011.110180
Penfield, T., Baker, M. J., Scoble, R., & Wykes, M. C. (2014). Assessment, evaluations, and definitions of research impact: A review. Research Evaluation, 23(1), 21–32. https://doi.org/10.1093/reseval/rvt021
Priem, J., Taraborelli, D., Groth, P., & Neylon, C. (2010). Altmetrics: A manifesto. http://altmetrics.org/manifesto
Reed, M. S., Ferré, M., Martin-Ortega, J., Blanche, R., Lawford-Rolfe, R., Dallimer, M., & Holden, J. (2021). Evaluating impact from research: A methodological framework. Research Policy, 50(4), Article 104147. https://doi.org/10.1016/j.respol.2020.104147
Research Excellence Framework. (2019). Guidance on submissions (REF 2019/01). https://2021.ref.ac.uk/publications-and-reports/guidance-on-submissions-201901/index.html
Seglen, P. O. (1997). Why the impact factor of journals should not be used for evaluating research. BMJ, 314(7079), 498–502. https://doi.org/10.1136/bmj.314.7079.497
Stern, N. (2016). Building on success and learning from experience: An independent review of the Research Excellence Framework. Department for Business, Energy & Industrial Strategy.
Stevenson, C., Gunashekar, S., & Guthrie, S. (2023, November 15). What the REF 2021 impact case studies can reveal about UK research. RAND Corporation. https://www.rand.org/pubs/commentary/2023/11/what-the-ref-2021-impact-case-studies-can-reveal-about.html
Strathern, M. (1997). 'Improving ratings': Audit in the British university system. European Review, 5(3), 305–321.
Thelwall, M., Haustein, S., Larivière, V., & Sugimoto, C. R. (2013). Do altmetrics work? Twitter and ten other social web services. PLoS ONE, 8(5), Article e64841. https://doi.org/10.1371/journal.pone.0064841
W. K. Kellogg Foundation. (2004). Logic model development guide. W. K. Kellogg Foundation.
Waltman, L. (2016). A review of the literature on citation impact indicators. Journal of Informetrics, 10(2), 365–391. https://doi.org/10.1016/j.joi.2016.02.007
Wilsdon, J., Allen, L., Belfiore, E., Campbell, P., Curry, S., Hill, S., Jones, R., Kain, R., Kerridge, S., Thelwall, M., Tinkler, J., Viney, I., Wouters, P., Hill, J., & Johnson, B. (2015). The metric tide: Report of the independent review of the role of metrics in research assessment and management. Higher Education Funding Council for England. https://doi.org/10.13140/RG.2.1.4929.1363