
Research · Communicating research
Presenting Research Findings With Clarity and Honesty
How to present research findings so that readers understand them correctly: reporting effect sizes and uncertainty, choosing clear number formats and charts, and avoiding spin.
A study can be well designed and carefully analysed and still mislead its readers if the findings are presented badly. Presentation decides which results readers notice, how large they think an effect is and how certain they believe it to be. This article covers the main practices that make findings both clear and honest, and the common ways in which presentation distorts them.
Report the size of the effect, not only whether it is significant
A p-value says how surprising the data would be if there were no effect. It does not say how large or important the effect is. The American Statistical Association's statement on p-values warned that scientific conclusions and business or policy decisions should not be based only on whether a p-value passes a threshold, and that a p-value does not measure the size of an effect or the importance of a result (Wasserstein & Lazar, 2016).
Cumming (2014) recommends reporting effect sizes with confidence intervals instead. "The new process reduced handling time by 4 minutes (95% CI 1 to 7 minutes)" tells the reader the best estimate, the range of values consistent with the data and, by implication, whether the result is precise enough to act on. A reader can judge whether a 1-minute saving would matter as well as a 7-minute one.
The same principle applies to results that are not significant. A non-significant result does not show that there is no effect; it may simply mean the study was too small to detect one. Altman and Bland (1995) put this as "absence of evidence is not evidence of absence". Reporting the confidence interval shows whether the data rule out an important effect or leave the question open.
Choose number formats that readers understand
Gigerenzer et al. (2007) reviewed evidence that many readers, including doctors, misunderstand statistics presented in some formats. Three practices help:
- Give absolute as well as relative figures. "Risk fell by 50%" may mean a fall from 40% to 20% or from 2 in 1,000 to 1 in 1,000. The relative figure alone tends to make effects seem larger.
- Use natural frequencies. "Of 1,000 people tested, 10 have the condition; 9 of these test positive, along with about 89 of the 990 who do not" is easier to follow than a set of conditional probabilities.
- Keep the reference class clear. State what a percentage is a percentage of, and use the same denominator when comparing groups.
Precision should match the data. Reporting a survey result from 200 respondents as 43.27% implies an accuracy the data do not have; 43% is more honest.
Design charts that show the data
Cleveland and McGill (1984) ranked the judgements people make when reading graphs by how accurately they are made, and tested parts of the ranking experimentally. Judgements of position along a common scale, as in dot plots and bar charts with a shared axis, were more accurate than judgements of length or of angle, as in pie charts, and they placed area and shading, as in shaded maps, lower still. The practical rule is to put the values to be compared along a common axis.
Tufte (2001) adds that charts should not distort the data, for example by using areas or volumes to show one-dimensional quantities. Bar charts should start at zero, because readers judge them by the length of the bar.
Charts can also hide information. Weissgerber et al. (2015) found that bar charts of means were widely used for continuous data in physiology journals, and showed that very different sets of data, with different distributions, outliers or sample sizes, can produce identical bar charts. For small samples they recommend showing the individual data points, for example with dot plots or box plots.
Avoid spin
Spin is reporting that makes results appear more favourable than the evidence supports. Boutron et al. (2010) examined reports of 72 randomised trials, published in December 2006, whose primary outcomes were not statistically significant. Many still presented the treatment as beneficial, by focusing on secondary outcomes, subgroups or within-group changes, or by interpreting a non-significant result as showing that treatments were equivalent.
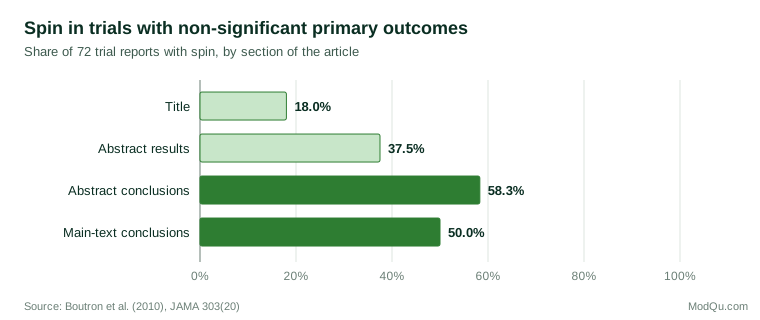
Spin was most common in the conclusions of abstracts, the part of a paper that is read most widely. A systematic review by Chiu et al. (2017) found spin across many types of biomedical study, not only trials.
Spin also grows as findings move away from the original paper. Sumner et al. (2014) compared university press releases about health research with the papers they described. Many press releases contained more direct advice, stronger causal claims or more confident inference from animal studies to humans than the papers did, and news stories were much more likely to contain such exaggeration when the press release did.
Common forms of spin to watch for in one's own writing include:
- describing a correlation in causal language ("X improves Y");
- emphasising a secondary outcome or subgroup when the main outcome showed no effect;
- describing a non-significant result as a "trend" toward significance;
- generalising from a narrow sample to a wider population without saying so;
- leaving limitations out of the summary or abstract.
Present all the planned results
Honest presentation means reporting the results of every planned analysis, not only those that worked. Where the full set is too long for the main text, it can go in an appendix or supplementary file, with the main text saying that it is there. Exploratory findings should be labelled as exploratory.
State uncertainty openly
Writers sometimes leave out uncertainty for fear of weakening their findings. Experiments by van der Bles et al. (2020) found that communicating uncertainty led to only a small decrease in trust in the numbers and in the source, mostly when the uncertainty was expressed in words rather than as a numerical range. Stating uncertainty is part of presenting the finding accurately, and readers appear to accept it.
A useful test before publishing is to ask whether a careful reader who saw only the title, the summary and the charts would come away with the same understanding as one who read every table. If not, the presentation needs to change.
References
Altman, D. G., & Bland, J. M. (1995). Statistics notes: Absence of evidence is not evidence of absence. BMJ, 311(7003), 485. https://doi.org/10.1136/bmj.311.7003.485
Boutron, I., Dutton, S., Ravaud, P., & Altman, D. G. (2010). Reporting and interpretation of randomized controlled trials with statistically nonsignificant results for primary outcomes. JAMA, 303(20), 2058–2064. https://doi.org/10.1001/jama.2010.651
Chiu, K., Grundy, Q., & Bero, L. (2017). 'Spin' in published biomedical literature: A methodological systematic review. PLOS Biology, 15(9), Article e2002173. https://doi.org/10.1371/journal.pbio.2002173
Cleveland, W. S., & McGill, R. (1984). Graphical perception: Theory, experimentation, and application to the development of graphical methods. Journal of the American Statistical Association, 79(387), 531–554. https://doi.org/10.1080/01621459.1984.10478080
Cumming, G. (2014). The new statistics: Why and how. Psychological Science, 25(1), 7–29. https://doi.org/10.1177/0956797613504966
Gigerenzer, G., Gaissmaier, W., Kurz-Milcke, E., Schwartz, L. M., & Woloshin, S. (2007). Helping doctors and patients make sense of health statistics. Psychological Science in the Public Interest, 8(2), 53–96. https://doi.org/10.1111/j.1539-6053.2008.00033.x
Sumner, P., Vivian-Griffiths, S., Boivin, J., Williams, A., Venetis, C. A., Davies, A., Ogden, J., Whelan, L., Hughes, B., Dalton, B., Boy, F., & Chambers, C. D. (2014). The association between exaggeration in health related science news and academic press releases: Retrospective observational study. BMJ, 349, Article g7015. https://doi.org/10.1136/bmj.g7015
Tufte, E. R. (2001). The visual display of quantitative information (2nd ed.). Graphics Press.
van der Bles, A. M., van der Linden, S., Freeman, A. L. J., & Spiegelhalter, D. J. (2020). The effects of communicating uncertainty on public trust in facts and numbers. Proceedings of the National Academy of Sciences, 117(14), 7672–7683. https://doi.org/10.1073/pnas.1913678117
Wasserstein, R. L., & Lazar, N. A. (2016). The ASA's statement on p-values: Context, process, and purpose. The American Statistician, 70(2), 129–133. https://doi.org/10.1080/00031305.2016.1154108
Weissgerber, T. L., Milic, N. M., Winham, S. J., & Garovic, V. D. (2015). Beyond bar and line graphs: Time for a new data presentation paradigm. PLOS Biology, 13(4), Article e1002128. https://doi.org/10.1371/journal.pbio.1002128