
Investigation · Method and the future
Quantitative Methods in Investigation: Using Statistics as Evidence
Statistics can show discrimination, reveal fraud and weigh forensic matches, but they are also easy to misread. This article explains how investigators use quantitative evidence, the common errors such as the prosecutor's fallacy, cases where statistics went wrong, and how to present numbers fairly.
Many investigations turn on numbers. An employer is accused of discriminating in hiring, and the question is whether the share of women hired is lower than chance would explain. An auditor suspects invented invoices, and the question is whether their amounts follow the patterns real transactions do. A DNA profile matches a suspect, and the question is how much that match should count. Statistics can answer such questions with a precision that no witness can offer. They can also mislead, sometimes catastrophically, when they are misunderstood by investigators, lawyers or juries. This article explains the main uses of statistics as evidence, the common errors, and how to use and present numbers responsibly.
Where statistics are used
Statistical evidence appears in many kinds of investigation:
- Discrimination. Courts have long accepted statistical comparisons between the make-up of a workforce or jury pool and the population it is drawn from. In Castaneda v. Partida (1977) and Hazelwood School District v. United States (1977), the United States Supreme Court considered how far observed numbers differed from what would be expected by chance, measured in standard deviations.
- Fraud and auditing. Fabricated figures often fail to follow the patterns of real data. Nigrini (2012) describes how auditors use Benford's law, which predicts how often each leading digit appears in many kinds of naturally occurring numbers, to identify accounts that deserve a closer look.
- Forensic science. DNA, glass, fibre and other trace evidence are interpreted by estimating how common a characteristic is, or how much more likely the evidence is if the suspect is the source than if someone else is (Aitken et al., 2010).
- Patterns of events. Investigators examine whether deaths, failures or complaints cluster in time or place, or around a particular person, more than would be expected.
Kaye and Freedman (2011) and Finkelstein and Levin (2015) provide detailed guides to these uses and the methods behind them.
Common errors
The prosecutor's fallacy. The most important error is to confuse two different probabilities: the probability of the evidence if the suspect is innocent, and the probability that the suspect is innocent given the evidence. Thompson and Schumann (1987) named this the prosecutor's fallacy and showed that mock jurors commonly made it. Suppose a trace matches one person in 1,000, and 10,000 people could have left it. About ten innocent people would be expected to match as well as the true source, so a match alone makes the suspect roughly one of eleven candidates, not 999 times in 1,000 guilty.
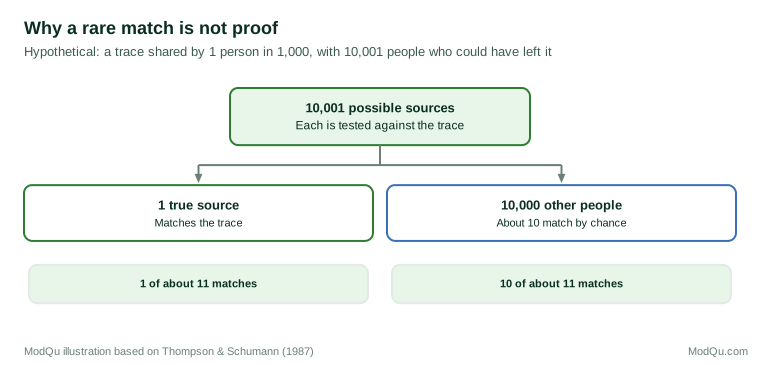
The opposite error, the defence attorney's fallacy, treats the match as almost worthless because many people share it, ignoring that it greatly narrows the field when combined with other evidence (Thompson & Schumann, 1987). Gigerenzer and Hoffrage (1995) found that people reason about such problems much more accurately when the numbers are presented as natural frequencies, as in the figure, rather than as probabilities.
Multiplying dependent probabilities. Probabilities can be multiplied only if the events are independent. In People v. Collins (1968), a prosecutor multiplied estimated frequencies of a couple's characteristics, such as a man with a moustache and a woman with a ponytail, to claim a 1 in 12 million chance of an innocent match. The California Supreme Court reversed the conviction, criticising both the unsupported figures and the assumption of independence.
Ignoring how the data were chosen. A cluster that is noticed first and then tested will look more surprising than it is, because some clusters always occur by chance somewhere. Meester et al. (2006) showed how this problem, and others, affected the statistical case against Lucia de Berk, a Dutch nurse convicted of murders on the basis of the number of deaths during her shifts. Her conviction was later quashed.
Simpson's paradox. A pattern in combined data can reverse when the data are split. Bickel et al. (1975) found that graduate admissions at the University of California, Berkeley appeared biased against women overall, but within most departments women were admitted at similar or higher rates; women had applied more often to departments that admitted fewer applicants.
Misreading significance. A small p-value does not measure the probability that a hypothesis is true or the size of an effect. The American Statistical Association has warned that conclusions should not rest on whether a p-value passes a threshold alone (Wasserstein & Lazar, 2016).
The Sally Clark case
The best-known example of statistical error in a criminal case is R v Clark (2003). Sally Clark was convicted in England in 1999 of murdering her two infant sons. An expert witness told the jury that the chance of two sudden infant deaths in a family like hers was about 1 in 73 million, a figure obtained by squaring the estimated rate for one death. This assumed the two deaths were independent, ignoring genetic and environmental factors that might make a second death more likely, and the figure was easily heard as the probability that she was innocent. The Royal Statistical Society publicly criticised the evidence (Royal Statistical Society, 2001). The Court of Appeal quashed her conviction in 2003, principally because evidence of an infection in one child had not been disclosed, but the case became a lasting warning about how statistics are presented in court.
Using statistics responsibly
Investigators and experts can reduce these risks:
- State the question precisely. Decide in advance what comparison will be made and what would count as unusual, rather than testing a pattern after noticing it.
- Check the assumptions. Ask whether events are independent, whether the comparison group is appropriate and whether the data were collected fairly.
- Use likelihood ratios. For forensic evidence, express how much more probable the evidence is under one explanation than another, rather than claiming a probability of guilt (Aitken et al., 2010).
- Present natural frequencies. Say "about 10 people in 10,000" rather than "a probability of 0.001", and show what the figure means for the case.
- Look for confounding. Split the data by relevant factors to check whether a pattern holds within groups.
- Seek review. Have a qualified statistician check important analyses before they are relied on.
Conclusion
Statistics give investigations a way to test claims of discrimination, detect fabricated records and weigh forensic matches. Courts accept them and often depend on them. But the same numbers can be misused through the prosecutor's fallacy, false assumptions of independence, after-the-fact selection of patterns and failure to account for confounding. Cases such as People v. Collins and R v Clark show the harm such errors can cause. Investigators who define their questions in advance, check assumptions, present numbers as natural frequencies and seek expert review can use quantitative evidence to make their findings stronger rather than merely more impressive.
References
Aitken, C., Roberts, P., & Jackson, G. (2010). Fundamentals of probability and statistical evidence in criminal proceedings: Guidance for judges, lawyers, forensic scientists and expert witnesses (Practitioner Guide No. 1). Royal Statistical Society.
Bickel, P. J., Hammel, E. A., & O'Connell, J. W. (1975). Sex bias in graduate admissions: Data from Berkeley. Science, 187(4175), 398–404. https://doi.org/10.1126/science.187.4175.398
Castaneda v. Partida, 430 U.S. 482 (1977).
Finkelstein, M. O., & Levin, B. (2015). Statistics for lawyers (3rd ed.). Springer.
Gigerenzer, G., & Hoffrage, U. (1995). How to improve Bayesian reasoning without instruction: Frequency formats. Psychological Review, 102(4), 684–704. https://doi.org/10.1037/0033-295X.102.4.684
Hazelwood School District v. United States, 433 U.S. 299 (1977).
Kaye, D. H., & Freedman, D. A. (2011). Reference guide on statistics. In National Research Council, Reference manual on scientific evidence (3rd ed., pp. 211–302). National Academies Press.
Meester, R., Collins, M., Gill, R., & van Lambalgen, M. (2006). On the (ab)use of statistics in the legal case against the nurse Lucia de B. Law, Probability and Risk, 5(3–4), 233–250. https://doi.org/10.1093/lpr/mgm003
Nigrini, M. J. (2012). Benford's law: Applications for forensic accounting, auditing, and fraud detection. Wiley.
People v. Collins, 68 Cal. 2d 319 (1968).
Royal Statistical Society. (2001, October 23). Royal Statistical Society concerned by issues raised in Sally Clark case [Press release].
R v Clark [2003] EWCA Crim 1020.
Thompson, W. C., & Schumann, E. L. (1987). Interpretation of statistical evidence in criminal trials: The prosecutor's fallacy and the defense attorney's fallacy. Law and Human Behavior, 11(3), 167–187. https://doi.org/10.1007/BF01044641
Wasserstein, R. L., & Lazar, N. A. (2016). The ASA statement on p-values: Context, process, and purpose. The American Statistician, 70(2), 129–133. https://doi.org/10.1080/00031305.2016.1154108