
Investigation · Method and the future
Link Analysis and Network Mapping in Investigations
Link analysis maps the connections between people, organisations, accounts, places and events, and network analysis measures their structure. This article explains how investigators build and analyse networks, the key measures they use, what research on criminal and organisational networks has found, and the pitfalls that can lead to wrong conclusions.
Many investigations are about relationships. Who called whom before a crime? Which companies share directors, addresses or bank accounts? Which accounts sent money to which others, and through whom? Which employees had access to the leaked documents and were in contact with the journalist? Link analysis is the practice of representing such relationships as a network of nodes (people, organisations, accounts, places, events) connected by links (calls, payments, shared addresses, meetings), so that patterns that are invisible in lists and spreadsheets become visible. Social network analysis adds mathematical measures that describe the structure of a network and the positions of individuals within it.
Link charts have been used in police intelligence since at least the 1970s, when Harper and Harris (1975) described how analysts could draw associations between suspects from investigative records to support decision-making. Today, link and network analysis is used in criminal intelligence, fraud and anti-money laundering investigations, investigative journalism, counter-terrorism, corporate due diligence and public health. This article explains how networks are built and analysed, what the key measures mean, what research on criminal networks has found, and the pitfalls that investigators must avoid.
Building a network
The first step is to decide what the nodes and links represent. A network might link people who telephoned each other, companies that share directors, bank accounts that exchanged payments, or people who attended the same meetings. Networks can also combine several types of node, such as people, companies, addresses and telephone numbers, which is common in fraud and financial investigations.
The data come from many sources: telephone and messaging records, financial transactions, company registries, property records, social media, surveillance logs, seized documents and interviews. Klerks (2001) describes how criminal intelligence analysts moved from simple association charts towards a "network paradigm" that treats criminal organisations as fluid networks rather than fixed hierarchies, and that draws on many data sources to map them.
Each link should be recorded with its source, date and strength, for example the number of calls or the amount of money transferred. A link that rests on one uncorroborated tip is not equivalent to one documented by hundreds of bank transfers, and the chart should show the difference.
Analysts must also decide how to treat different kinds of evidence of a link. Some links are direct observations, such as a recorded call or a bank transfer. Others are inferences, such as two people being linked because they used the same internet address or travelled on the same flight. Inferred links can be valuable leads, but they are weaker and may have innocent explanations: many people share internet addresses in offices, hotels and mobile networks. Keeping direct and inferred links separate in the data, and labelling them clearly, allows later users of the analysis to judge how much weight each link deserves. It also allows the network to be rebuilt quickly when new evidence confirms or rules out an inferred link, which happens often as an investigation develops.
Seeing the network
Visualisation makes patterns visible: clusters of closely connected nodes, isolated individuals, and people who connect otherwise separate groups.
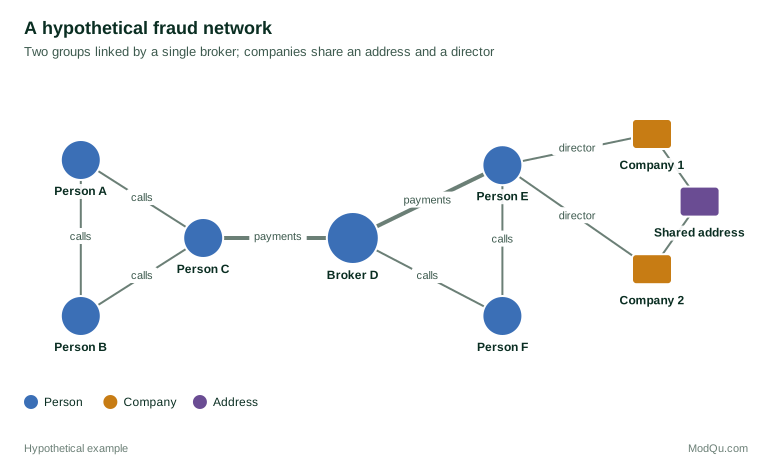
Visualisation also has risks. The layout of a chart can suggest importance or closeness that the data do not support, and a dense chart can look impressive while revealing little. Analysts should use charts to generate questions and present findings, not as proof in themselves.
Measuring position: centrality
Network analysis provides measures of each node's position. The most widely used are measures of centrality, which Freeman (1978) clarified in an influential article (Wasserman & Faust, 1994; Borgatti et al., 2018).
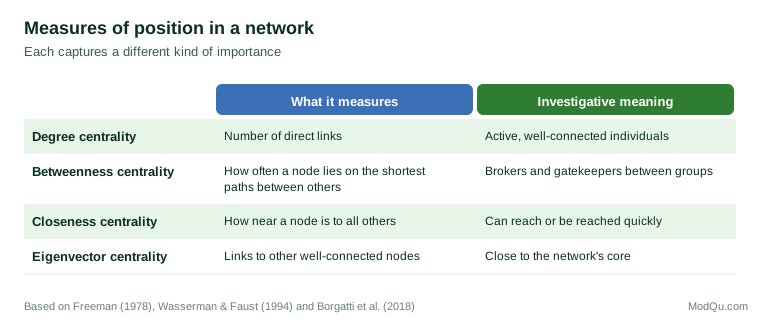
Degree centrality counts a node's direct links. A person with many contacts may be an active organiser, but may also be a low-level operator who deals with many customers.
Betweenness centrality measures how often a node lies on the shortest paths between other nodes. People with high betweenness act as brokers or gatekeepers, connecting groups that would otherwise be separate. Burt (1992) showed in business settings that people who bridge "structural holes" between groups gain information and control advantages. In criminal networks, brokers often play crucial roles, for example linking suppliers with distributors.
Closeness centrality measures how close a node is to all others, indicating how quickly information or resources could reach it or spread from it.
Eigenvector centrality gives more weight to links with nodes that are themselves well connected, identifying those close to the network's core.
Granovetter (1973) showed that "weak ties", links to acquaintances rather than close friends, are often the bridges through which new information flows between groups. In investigations, weak ties can reveal how separate criminal groups or companies are connected.
What research on criminal networks shows
Research on criminal networks has challenged the image of organised crime as a rigid hierarchy. Sparrow (1991) assessed the prospects for applying network analysis to criminal intelligence, noting that criminal networks are incomplete, have fuzzy boundaries and change over time, and that these features require care in analysis. Krebs (2002) mapped the network of the hijackers involved in the attacks of 11 September 2001 from public information and showed that the hijackers were connected by sparse links, with a few individuals playing key roles in connecting cells.
Morselli (2009) studied several criminal networks using police data and found that they were typically flexible and decentralised, and that the people who were most central were not always the leaders. Leaders often kept a low profile, staying away from the centre to reduce their exposure, while brokers who connected different parts of the network were vital to its functioning. Morselli et al. (2007) described an "efficiency/security trade-off": criminal networks that need to act quickly benefit from dense connections, but dense connections increase the risk of detection, so groups with longer time horizons tend to be more dispersed.
Studies of drug trafficking networks have produced similar findings. Natarajan (2006) analysed intercepted telephone conversations in a large heroin distribution network in New York and found that it consisted of small, loosely connected groups with a few key individuals coordinating between them. Bright et al. (2012) mapped an Australian methamphetamine syndicate from court documents and found that individuals in brokerage positions were especially important to the network. Campana and Varese (2012) set out criteria and techniques for using telephone intercepts as a source of network data, including how to code relationships and assess their reliability.
Network analysis has also been used to prevent harm. Papachristos et al. (2012) studied a network of co-offenders in Boston and found that the risk of being shot was strongly related to a person's position in the network, more than to individual characteristics, a finding used to focus violence prevention efforts on those at highest risk.
Disrupting networks
Network analysis can inform decisions about whom to target. Removing the most connected person may not disrupt a network if others can take over their role, whereas removing a broker may split it into disconnected parts. Carley et al. (2002) used simulations to show that networks can recover from the removal of central individuals and that the most effective targets depend on the network's structure and its ability to adapt. Xu and Chen (2005) described tools that combine network analysis with visualisation to identify subgroups, central members and the interactions between groups in criminal networks, supporting such decisions.
Networks over time
A single chart shows a network as if it were fixed, but real networks change. People join and leave, relationships strengthen and fade, and roles shift when members are arrested or fall out. Analysing a network at several points in time, for example month by month, can show when a new broker emerged, when a group split, or how the network adapted after an arrest. Time also helps test causal claims: if a payment always follows a particular call within a day, the sequence is more informative than either link alone.
Networks can also have several layers. The same people may be connected by phone calls, payments, shared addresses and family ties, and each layer can tell a different story. A person who appears peripheral in the call network may be central in the financial network. Examining layers separately before combining them helps prevent one dense layer, such as telephone data, from hiding patterns in others.
Presenting network evidence
Network charts are persuasive, which makes them both useful and dangerous in reports and in court. A clear chart can help a jury or a manager understand a complex set of relationships in a few seconds. A cluttered or selectively drawn chart can suggest guilt by association. Good practice is to keep charts simple, showing only the nodes and links relevant to the point being made; to state in the legend what each type of link represents and where the data came from; to distinguish confirmed links from inferred ones, for example with solid and dashed lines; and to make the underlying data available so that the chart can be checked. Analysts should also be ready to explain any network measures they report in plain language, and to acknowledge what the network does not show.
Tools
Analysts use a range of software, from general tools that draw charts from spreadsheets to specialised platforms that import telephone records, transactions and registry data, merge duplicate entities and calculate network measures. Whatever the tool, the quality of the result depends on the quality of the data and the care taken in resolving entities: deciding, for example, whether "J. Smith" at one address and "John Smith" at another are the same person. Errors in entity resolution can create links that do not exist or hide links that do.
Applications beyond crime
Link and network analysis is widely used outside criminal intelligence. Anti-money laundering teams map flows of funds between accounts and companies to detect structures designed to disguise the origin of money. Due diligence investigators map the ownership and control of companies to identify the people behind them. Investigative journalists used network analysis to navigate the millions of documents in the Panama Papers, linking offshore companies, intermediaries and beneficial owners (Obermayer & Obermaier, 2016). Telephone metadata can reveal sensitive relationships and activities even without the content of calls (Mayer et al., 2016), which is why such data are both valuable to investigators and protected by law.
Pitfalls
Network analysis is powerful but can mislead in several ways.
Missing data. Investigators rarely see the whole network. Some people avoid using phones, some transactions are in cash, and some links are never recorded. Kossinets (2006) showed that missing data can substantially distort network measures, especially centrality, and that the distortion depends on how the data are missing. Sparrow (1991) warned that criminal networks are, by their nature, incompletely observed.
Boundary problems. Deciding where a network ends is difficult. Including too many peripheral contacts can bury the important structure; including too few can miss key connections.
Biased data. Data from police investigations reflect who was investigated and how. Faust and Tita (2019) caution that network data on crime often come from police records that capture only those who came to police attention, and that conclusions about network structure may reflect enforcement patterns as much as criminal behaviour.
Links are not guilt. A link shows that two nodes are connected, not that both are involved in wrongdoing. A person may call a suspect because they are a relative, a neighbour or a customer of a legitimate business. Treating association as evidence of involvement is one of the most serious risks of link analysis.
Confirmation bias. Charts are built by people who often already have a theory. Heuer and Pherson (2015) recommend structured techniques, such as considering alternative hypotheses and seeking disconfirming evidence, to reduce this risk.
A short example
The following hypothetical case illustrates the method. A bank's financial crime team is alerted to a series of unusual transfers into a small business account. The team gathers the account's transactions and those of the accounts it pays, adds company registry information and the bank's records of customers' addresses and telephone numbers, and builds a network.
The chart shows that money enters the business account from 40 personal accounts, many opened recently, and is then transferred to three companies. The three companies share a registered address and two directors. Betweenness centrality highlights one personal account that receives funds from the incoming accounts and pays them on, acting as a broker between the two parts of the network. Several of the incoming accounts share a telephone number.
The team does not treat the chart as proof. It checks whether the business has a legitimate explanation, reviews the account opening documents and finds that several of the incoming account holders were students recruited through social media to receive and pass on money, a pattern associated with money mule activity. The bank files a suspicious activity report, which includes the chart, a description of each link and its source, and a clear statement of what is known and what is inferred.
Conclusion
Link analysis and network mapping turn scattered information about relationships into a picture of how people, organisations and resources are connected. Measures such as degree and betweenness centrality help identify active members and key brokers, and research on criminal networks shows that these brokers, rather than visible leaders, are often essential to how networks function. The method's value depends on careful data collection, recorded sources, awareness of missing and biased data, and the discipline to treat links as leads to be tested rather than as proof of guilt.
References
Borgatti, S. P., Everett, M. G., & Johnson, J. C. (2018). Analyzing social networks (2nd ed.). SAGE.
Bright, D. A., Hughes, C. E., & Chalmers, J. (2012). Illuminating dark networks: A social network analysis of an Australian drug trafficking syndicate. Crime, Law and Social Change, 57(2), 151–176. https://doi.org/10.1007/s10611-011-9336-z
Burt, R. S. (1992). Structural holes: The social structure of competition. Harvard University Press.
Campana, P., & Varese, F. (2012). Listening to the wire: Criteria and techniques for the quantitative analysis of phone intercepts. Trends in Organized Crime, 15(1), 13–30. https://doi.org/10.1007/s12117-011-9131-3
Carley, K. M., Lee, J.-S., & Krackhardt, D. (2002). Destabilizing networks. Connections, 24(3), 79–92.
Faust, K., & Tita, G. E. (2019). Social networks and crime: Pitfalls and promises for advancing the field. Annual Review of Criminology, 2, 99–122. https://doi.org/10.1146/annurev-criminol-011518-024701
Freeman, L. C. (1978). Centrality in social networks conceptual clarification. Social Networks, 1(3), 215–239. https://doi.org/10.1016/0378-8733(78)90021-7
Granovetter, M. S. (1973). The strength of weak ties. American Journal of Sociology, 78(6), 1360–1380. https://doi.org/10.1086/225469
Harper, W. R., & Harris, D. H. (1975). The application of link analysis to police intelligence. Human Factors, 17(2), 157–164. https://doi.org/10.1177/001872087501700203
Heuer, R. J., Jr., & Pherson, R. H. (2015). Structured analytic techniques for intelligence analysis (2nd ed.). CQ Press.
Klerks, P. (2001). The network paradigm applied to criminal organizations. Connections, 24(3), 53–65.
Kossinets, G. (2006). Effects of missing data in social networks. Social Networks, 28(3), 247–268. https://doi.org/10.1016/j.socnet.2005.07.002
Krebs, V. E. (2002). Mapping networks of terrorist cells. Connections, 24(3), 43–52.
Mayer, J., Mutchler, P., & Mitchell, J. C. (2016). Evaluating the privacy properties of telephone metadata. Proceedings of the National Academy of Sciences, 113(20), 5536–5541. https://doi.org/10.1073/pnas.1508081113
Morselli, C., Giguère, C., & Petit, K. (2007). The efficiency/security trade-off in criminal networks. Social Networks, 29(1), 143–153. https://doi.org/10.1016/j.socnet.2006.05.001
Morselli, C. (2009). Inside criminal networks. Springer.
Natarajan, M. (2006). Understanding the structure of a large heroin distribution network: A quantitative analysis of qualitative data. Journal of Quantitative Criminology, 22(2), 171–192. https://doi.org/10.1007/s10940-006-9007-x
Obermayer, B., & Obermaier, F. (2016). The Panama Papers: Breaking the story of how the rich and powerful hide their money. Oneworld.
Papachristos, A. V., Braga, A. A., & Hureau, D. M. (2012). Social networks and the risk of gunshot injury. Journal of Urban Health, 89(6), 992–1003. https://doi.org/10.1007/s11524-012-9703-9
Sparrow, M. K. (1991). The application of network analysis to criminal intelligence: An assessment of the prospects. Social Networks, 13(3), 251–274. https://doi.org/10.1016/0378-8733(91)90008-H
Wasserman, S., & Faust, K. (1994). Social network analysis: Methods and applications. Cambridge University Press.
Xu, J., & Chen, H. (2005). Criminal network analysis and visualization. Communications of the ACM, 48(6), 100–107. https://doi.org/10.1145/1064830.1064834