
Investigation · Digital investigation
Automated Lead Generation and Prioritization in Digital Investigations
Digital investigations now generate far more potential leads than investigators can follow. This article explains how automated systems generate and rank leads, from keyword and hash matching to machine learning, network analysis and anomaly detection, why rare events produce many false alerts, the risks of bias and over-reliance, and how to validate and govern these systems.
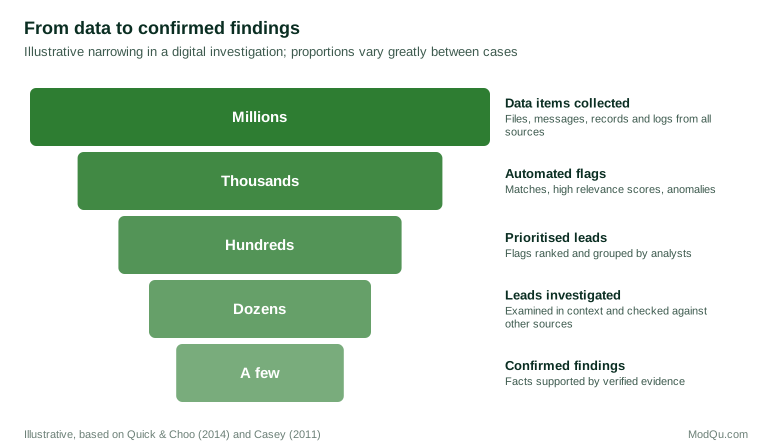
A modern digital investigation can involve terabytes of data from phones, computers, cloud accounts, network logs and financial records. Investigators cannot read it all. Instead, they increasingly rely on software to suggest where to look: to flag files, messages, accounts, transactions or people that deserve attention, and to rank them so that the most promising come first. These are automated leads. They can turn an impossible task into a manageable one, but they also shape what an investigation sees and what it misses. This article explains the main methods of automated lead generation and prioritisation, why they often produce many false alerts, the risks of bias and over-reliance, and the safeguards needed.
Why automation became necessary
Garfinkel (2010) warned that growing storage capacity, device diversity, encryption and cloud services would overwhelm traditional forensic methods, in which an examiner reviewed each device in full. Quick and Choo (2014) confirmed that the volume of digital evidence had grown faster than forensic capacity, producing backlogs in many police forces and long delays in cases. Automated triage and lead generation are the main responses. They aim to identify, quickly and consistently, the small fraction of data most likely to matter.
Casey (2011) emphasises that whatever tools are used, digital evidence must still be preserved, documented and verified. Automation changes how investigators select what to examine; it does not remove the need to examine it properly.
Methods of generating leads
Known-item matching. The simplest methods compare data against lists of known items. Cryptographic hash values allow known files, such as previously identified illegal images or malware, to be found instantly, and known-good files, such as operating system components, to be excluded. Exact hashes fail if a file is altered even slightly; similarity hashing techniques, such as context-triggered piecewise hashing, can identify files that are nearly identical (Kornblum, 2006). Keyword searches, watch lists of names, phone numbers, email addresses and cryptocurrency addresses work in the same way.
Feature extraction and cross-referencing. Garfinkel (2006) showed that extracting features such as email addresses, credit card numbers and phone numbers from many devices, and then cross-referencing them, could reveal connections between seized drives that individual examination would miss. A phone number appearing on several suspects' devices, for example, is a lead even if no one had searched for it.
Ranking by learned relevance. In technology-assisted review, a model learns from investigators' judgements about sample documents and ranks the remainder by likely relevance. Grossman and Cormack (2011) found that this approach could find relevant documents at least as effectively as exhaustive manual review with far less effort, and Cormack and Grossman (2014) found that continuous active learning, in which the model is retrained as reviewers code the highest-ranked documents, performed particularly well.
Network analysis. Communications, financial and social media data can be represented as networks of people and accounts. Measures of centrality identify people who are highly connected or who link otherwise separate groups. Sparrow (1991) described the potential of network analysis for criminal intelligence, while noting that intelligence networks are incomplete, have fuzzy boundaries and change over time, which makes such measures uncertain.
Anomaly detection. Models learn what normal activity looks like and flag departures from it: unusual login times, large data transfers, payments to new beneficiaries, or patterns resembling known fraud. Bolton and Hand (2002) reviewed statistical methods for fraud detection and noted that they identify suspicious records, not proven fraud; each flag needs investigation.
Location and pattern analysis. Geographic methods rank areas or suspects by proximity to linked incidents. Rossmo (2000) developed geographic profiling to prioritise suspects and areas in serial crime investigations based on the locations of offences.
Transaction tracing. In cryptocurrency investigations, analysis of the public ledger can cluster addresses controlled by the same entity and trace funds to exchanges where identities may be known. Meiklejohn et al. (2013) showed early on that such clustering could link many Bitcoin addresses to real-world services, producing leads for further enquiry.
From leads to priorities
Generating leads is only half the task; the other half is deciding which to pursue first. Prioritisation systems combine several signals, such as the number of independent indicators, the seriousness of the potential offence, the risk to victims and the cost of following the lead, into a score or ranking. Intelligence-led policing similarly uses analysis to direct limited resources to the most significant problems and offenders (Ratcliffe, 2016).
The problem of rare events
Many of the things investigators look for are rare: one fraudulent payment among millions, one malicious login among billions. Axelsson (2000) showed that this makes automated detection fundamentally difficult. When true cases are rare, even a system with a low false positive rate will generate many more false alarms than true ones. Sommer and Paxson (2010) explained further why machine learning struggles with intrusion detection: normal behaviour varies widely, attacks are rare and diverse, errors are costly, and it is hard to evaluate systems on realistic data.
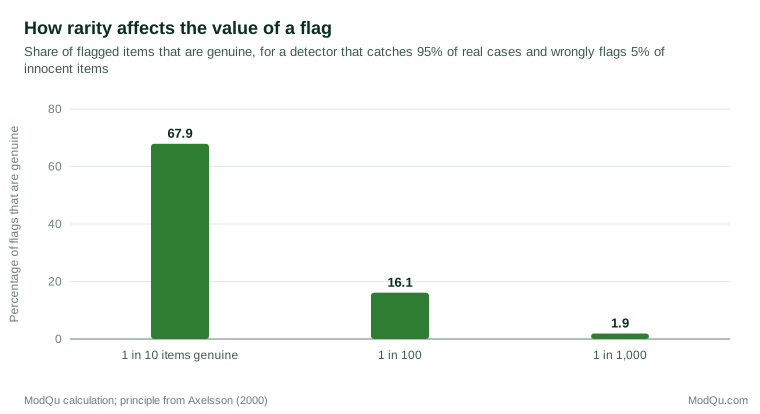
The practical consequence is that a flag on its own is weak evidence when the target is rare. Investigators need to know the base rate and the system's error rates to judge what a flag means, and should combine several independent indicators before treating a lead as strong. Fawcett (2006) explains how receiver operating characteristic analysis can show the trade-off between catching more true cases and generating more false alerts as a system's threshold is changed; the right threshold depends on the cost of each type of error and the resources available to follow up.
Bias and feedback loops
Automated systems learn from historical data, and that data reflects past decisions about whom to investigate. Lum and Isaac (2016) showed that a predictive policing algorithm trained on drug arrest records would direct police to the same areas that had been heavily policed before, even though survey data suggested drug use was spread much more widely. Because new arrests then feed back into the training data, the system can reinforce its own predictions. Richardson et al. (2019) documented cases in which police departments under investigation for unlawful practices used data generated by those practices to build predictive systems.
Brayne (2017) found that data platforms at the Los Angeles Police Department allowed officers to flag people for attention on the basis of connections to others in the system, including people with no direct police contact. Ferguson (2017) argues that such systems can extend suspicion to people on the basis of their associations or neighbourhoods rather than their conduct. Face recognition, often used to generate identity leads from images, has shown higher false match rates for some demographic groups in many algorithms (Grother et al., 2019).
Automation bias
Investigators may treat a highly ranked lead as more significant than it is. Parasuraman and Manzey (2010) found that people using automated aids tend to become complacent, monitoring the system's outputs less critically and failing to notice when it is wrong. A lead generated by software can acquire an authority that steers the investigation towards a particular person and away from alternatives. Equally, items that the system ranks low may never be examined, even if they are critical.
Lawful and proportionate use
Automated lead generation raises legal questions as well as technical ones. Running a whole collection through matching or anomaly detection tools means processing large amounts of data about people who are not suspected of anything, including colleagues, family members and customers whose messages happen to be on a seized device. Investigators should be able to show that the search was within the scope of their authority, such as a warrant or an internal policy, that the criteria used were relevant to the matter, and that data about uninvolved people were not retained or used for other purposes. Searching data collected for one case to generate leads in an unrelated case may be unlawful or require separate authorisation. Keeping these limits in mind protects both the people whose data are processed and the admissibility of the evidence that results.
Validation and governance
Several safeguards help investigators gain the benefits of automated leads while managing the risks:
- Test against known data. Before relying on a tool, run it on data where the answers are known, and measure what it finds and misses.
- Know the error rates. Record the system's sensitivity and false positive rate, and the base rate in the population being searched, so that the meaning of a flag can be judged.
- Sample what was excluded. Review a random sample of low-ranked or unflagged material to estimate what has been missed. This is standard practice in technology-assisted review.
- Require independent corroboration. Treat a lead as a reason to investigate, not as evidence. Confirm each lead through sources independent of the system that generated it.
- Check for bias. Examine whether leads fall disproportionately on particular groups or areas, and whether that reflects the underlying conduct or the history of enforcement.
- Document the process. Record which tools, versions, rules, thresholds and training data were used, so that the selection of leads can be explained and challenged.
- Follow the law. The European Union's AI Act classifies many AI systems used by law enforcement to assess the risk of offending or to evaluate the reliability of evidence as high-risk, imposing requirements for risk management, data governance, documentation and human oversight (Regulation (EU) 2024/1689, 2024).
A short example
The following hypothetical case illustrates these safeguards. A company's security team investigates a suspected leak of customer data. Its monitoring system flags 2,400 unusual data transfers over three months. Knowing that the system wrongly flags about 2 per cent of normal activity, the team calculates that most flags will be false and does not treat any single flag as significant. It combines the flags with two independent indicators: access to the customer database outside normal working hours, and transfers to personal cloud accounts. Eleven accounts meet all three criteria. The team reviews each in context, finds that nine reflect legitimate remote work, and focuses on the remaining two. It also samples 200 unflagged transfers to check that the system has not missed a different pattern, and finds none. Examination of the two accounts confirms that one employee copied customer records to a personal account. The report records the thresholds, the combination of indicators, the results of the sampling and the reasons the other nine accounts were cleared.
Conclusion
Automated lead generation and prioritisation have become essential in digital investigations because the volume of data exceeds what people can review. Methods range from hash and keyword matching to learned relevance ranking, network analysis, anomaly detection and transaction tracing. Their outputs, however, are only as good as their data and design. Rare targets produce many false alerts, historical data can embed bias, and people tend to over-trust automated rankings. Investigators who test their tools, understand error and base rates, sample what was excluded, seek independent corroboration and document their methods can use automation to find what matters without letting it decide what is true.
References
Axelsson, S. (2000). The base-rate fallacy and the difficulty of intrusion detection. ACM Transactions on Information and System Security, 3(3), 186–205. https://doi.org/10.1145/357830.357849
Bolton, R. J., & Hand, D. J. (2002). Statistical fraud detection: A review. Statistical Science, 17(3), 235–255. https://doi.org/10.1214/ss/1042727940
Brayne, S. (2017). Big data surveillance: The case of policing. American Sociological Review, 82(5), 977–1008. https://doi.org/10.1177/0003122417725865
Casey, E. (2011). Digital evidence and computer crime: Forensic science, computers and the internet (3rd ed.). Academic Press.
Cormack, G. V., & Grossman, M. R. (2014). Evaluation of machine-learning protocols for technology-assisted review in electronic discovery. In Proceedings of the 37th International ACM SIGIR Conference on Research and Development in Information Retrieval (pp. 153–162). ACM. https://doi.org/10.1145/2600428.2609601
Fawcett, T. (2006). An introduction to ROC analysis. Pattern Recognition Letters, 27(8), 861–874. https://doi.org/10.1016/j.patrec.2005.10.010
Ferguson, A. G. (2017). The rise of big data policing: Surveillance, race, and the future of law enforcement. NYU Press.
Garfinkel, S. L. (2010). Digital forensics research: The next 10 years. Digital Investigation, 7(Suppl.), S64–S73. https://doi.org/10.1016/j.diin.2010.05.009
Garfinkel, S. L. (2006). Forensic feature extraction and cross-drive analysis. Digital Investigation, 3(Suppl.), 71–81. https://doi.org/10.1016/j.diin.2006.06.007
Grossman, M. R., & Cormack, G. V. (2011). Technology-assisted review in e-discovery can be more effective and more efficient than exhaustive manual review. Richmond Journal of Law and Technology, 17(3), Article 11.
Grother, P., Ngan, M., & Hanaoka, K. (2019). Face recognition vendor test (FRVT) part 3: Demographic effects (NISTIR 8280). National Institute of Standards and Technology. https://doi.org/10.6028/NIST.IR.8280
Kornblum, J. (2006). Identifying almost identical files using context triggered piecewise hashing. Digital Investigation, 3(Suppl.), 91–97. https://doi.org/10.1016/j.diin.2006.06.015
Lum, K., & Isaac, W. (2016). To predict and serve? Significance, 13(5), 14–19. https://doi.org/10.1111/j.1740-9713.2016.00960.x
Meiklejohn, S., Pomarole, M., Jordan, G., Levchenko, K., McCoy, D., Voelker, G. M., & Savage, S. (2013). A fistful of bitcoins: Characterizing payments among men with no names. In Proceedings of the 2013 Internet Measurement Conference (pp. 127–140). ACM. https://doi.org/10.1145/2504730.2504747
Parasuraman, R., & Manzey, D. H. (2010). Complacency and bias in human use of automation: An attentional integration. Human Factors, 52(3), 381–410. https://doi.org/10.1177/0018720810376055
Quick, D., & Choo, K.-K. R. (2014). Impacts of increasing volume of digital forensic data: A survey and future research challenges. Digital Investigation, 11(4), 273–294. https://doi.org/10.1016/j.diin.2014.09.002
Ratcliffe, J. H. (2016). Intelligence-led policing (2nd ed.). Routledge.
Regulation (EU) 2024/1689 of the European Parliament and of the Council of 13 June 2024 laying down harmonised rules on artificial intelligence (Artificial Intelligence Act). (2024). Official Journal of the European Union, L.
Richardson, R., Schultz, J. M., & Crawford, K. (2019). Dirty data, bad predictions: How civil rights violations impact police data, predictive policing systems, and justice. New York University Law Review Online, 94, 15–55.
Rossmo, D. K. (2000). Geographic profiling. CRC Press.
Sommer, R., & Paxson, V. (2010). Outside the closed world: On using machine learning for network intrusion detection. In 2010 IEEE Symposium on Security and Privacy (pp. 305–316). IEEE. https://doi.org/10.1109/SP.2010.25
Sparrow, M. K. (1991). The application of network analysis to criminal intelligence: An assessment of the prospects. Social Networks, 13(3), 251–274. https://doi.org/10.1016/0378-8733(91)90008-H