
Intelligence · Open-source intelligence
"Search Data as Intelligence: What Query Trends Reveal About Demand"
What people type into search engines reveals what they want, worry about and plan to buy. This article explains how search data are used to measure and anticipate demand, what the research shows, and the traps that caught some of the best-known attempts.
Before people buy a car, book a holiday, look for a job or visit a doctor, many of them search the internet. The queries they type are a record of intentions, needs and concerns, captured at the moment they arise and often before any purchase or official statistic. Search engines publish aggregated, anonymised indexes of search interest, most widely through Google Trends, which show how interest in a term changes over time and across regions. This article explains how such data can serve as intelligence about demand, what research has found, and the limits that every user should understand.
What search data measure
Search indexes do not report the number of searches. Google Trends, for example, reports the share of all searches in a given place and period that were for a term, scaled so that the highest point in the selected period equals 100. The figures come from a sample of searches, so values can differ slightly from one download to the next. Mavragani et al. (2018), in a systematic review of research using the service, found that many studies did not report how they selected terms, regions and periods, making results hard to check or repeat.
Because the index is relative, a fall in a term's value can mean that fewer people searched for it, or that searches for everything else increased. And because terms are matched as typed, the choice of words matters: people may search for a brand, a product type, a problem or a symptom.
Predicting the present
The most established use of search data is nowcasting: estimating current conditions before official figures are published. Choi and Varian (2012) showed that adding search data to simple forecasting models improved estimates of car sales, unemployment claims, travel and consumer confidence in the United States. They called this "predicting the present", since many official statistics are released weeks after the period they describe.
Other studies found similar results. Askitas and Zimmermann (2009) used searches related to job seeking to improve forecasts of unemployment in Germany. Carrière-Swallow and Labbé (2013) showed that search data improved nowcasts of car sales in Chile, an emerging market where timely official data are scarce. Wu and Brynjolfsson (2015) found that housing-related searches helped predict future house sales and prices in the United States.
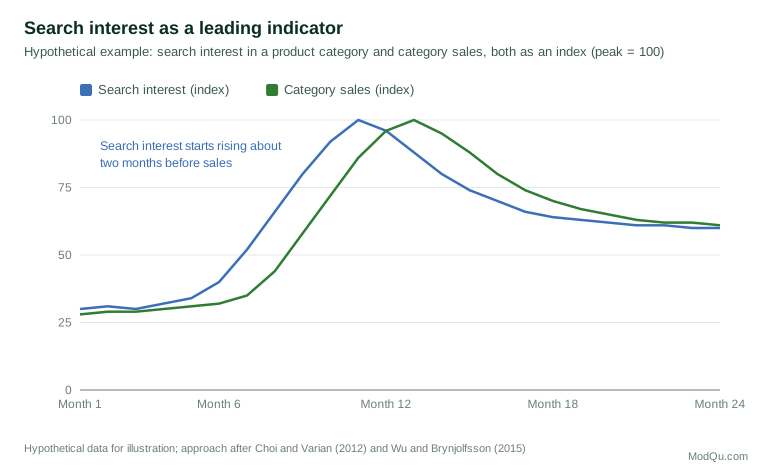
Goel et al. (2010) tested search data against outcomes such as film box-office revenue, video game sales and song rankings. Search volume did predict these outcomes, but often only modestly better than simple models using other publicly available information. Their result is a useful corrective: search data add most value where other timely data are lacking.
Measuring attention and hidden attitudes
Search data also measure attention. Da et al. (2011) proposed search volume for company names as a direct measure of investor attention, and found that rises in searches for a company's share were followed by higher prices over the next two weeks and an eventual reversal. Preis et al. (2013) reported that increases in searches for financial terms tended to precede falls in a stock market index.
Because searches are made privately, they may reveal attitudes that people would not express in a survey. Stephens-Davidowitz (2014) used the regional frequency of racially charged searches to estimate how prejudice affected votes for a black presidential candidate, showing that search data can capture sentiments that surveys miss because of social desirability.
The Google Flu Trends lesson
The best-known cautionary tale concerns influenza. Ginsberg et al. (2009) found that a combination of search terms related to flu symptoms tracked official estimates of influenza activity closely, and could produce estimates about a week or two earlier. The resulting service attracted great attention. A few seasons later, it substantially overestimated flu levels; Butler (2013) reported that its estimate for a peak in the 2012–2013 season was roughly double the official figure.
Lazer et al. (2014) analysed what went wrong. The model had been built by selecting, from tens of millions of candidate terms, those that best matched past flu data, so some terms matched by chance or through seasonal coincidence. Changes to the search engine, such as suggested searches, altered what people typed. Media coverage of flu prompted searches by people who were not ill. And the model was not regularly recalibrated against official data. They concluded that search data are most valuable when combined with traditional data, not when used to replace them.
Using search data well
The research suggests several principles:
- Start with a hypothesis. Choose terms because there is a reason to expect them to relate to the outcome, not because they correlate with it in past data. Searching thousands of terms for correlations will find some by chance.
- Combine with other data. Add search data to existing forecasting models and check whether they improve accuracy on data the model has not seen. Scott and Varian (2014) describe a statistical approach that selects useful search terms while guarding against overfitting.
- Test out of sample. Hyndman and Athanasopoulos (2021) stress that forecasting methods must be judged on how well they predict periods not used to build them.
- Recalibrate regularly. Relationships between searches and behaviour change as platforms, products and habits change.
- Watch for media effects. News coverage can cause spikes in searches unrelated to demand.
- Record the details. Note the exact terms, region, period, category and download date, so that results can be checked.
Salganik (2018) notes that data like these are "always on" but also "drifting": the population of users, their behaviour and the system that records them all change over time. Treating search data as a stable measuring instrument is the most common mistake.
Other limits
Several further limits deserve attention. Search data cover only people who use a particular search engine, and the share of searching done on any one engine differs between countries and age groups. Small regions and rare terms may show no data at all, because search services suppress values below a privacy threshold, or may show erratic swings because the underlying numbers are small. Increasingly, people also search within shopping sites, social media and voice assistants, which do not appear in web search indexes. A product whose buyers mainly search on a retailer's own site may show little web search interest even when sales are strong.
Search interest also mixes different motives. People search for a product because they want to buy it, because they own it and have a problem, because they saw it in the news or because they want to compare it with an alternative. Looking at related queries, and choosing terms that indicate buying intent, such as those containing "price", "buy" or "near me", helps separate these motives.
Business applications
For businesses, search data can serve several practical purposes:
- Demand sensing. Tracking searches for product categories, brands and related problems gives early warning of changes in demand, useful for inventory and staffing.
- Regional comparison. Comparing search interest across provinces, cities or countries helps identify markets with growing interest before sales data accumulate.
- Competitor tracking. Relative search interest in competing brands is a rough, timely indicator of changing attention, especially after launches or campaigns.
- Understanding needs. Related searches reveal the questions and problems people associate with a product, which can inform product design and communication.
- Campaign evaluation. Changes in searches for a brand after advertising give a quick, if imperfect, indicator of effect.
An illustration
A Canadian retailer of heat pumps wants earlier warning of demand to plan its stock and installer schedules. Its analysts select terms that buyers are likely to use, such as the product type, "heat pump rebate" and "heat pump installation", and download monthly search indexes for each province over five years. They add the indexes to the forecasting model they already use, which is based on past sales and seasonal patterns, and test it on the most recent two years, which were held back. The search data improve forecasts by a modest but useful margin, mainly by detecting the jump in interest when a new government rebate programme was announced, a month before orders rose. The retailer adopts the improved model, sets an alert for sudden rises in rebate-related searches, and reviews the terms and model every six months.
Conclusion
Search data record what people want to know at the moment they want to know it. Used carefully, they help organisations estimate current demand before official figures appear, compare regions, track attention and detect shifts early. Used carelessly, they produce confident errors, as the story of Google Flu Trends showed. The lessons are consistent: choose terms for good reasons, combine search data with traditional data, test forecasts on unseen periods, recalibrate often and remember that the index measures relative interest, not sales.
References
Askitas, N., & Zimmermann, K. F. (2009). Google econometrics and unemployment forecasting. Applied Economics Quarterly, 55(2), 107–120. https://doi.org/10.3790/aeq.55.2.107
Butler, D. (2013). When Google got flu wrong. Nature, 494(7436), 155–156. https://doi.org/10.1038/494155a
Carrière-Swallow, Y., & Labbé, F. (2013). Nowcasting with Google Trends in an emerging market. Journal of Forecasting, 32(4), 289–298. https://doi.org/10.1002/for.1252
Choi, H., & Varian, H. (2012). Predicting the present with Google Trends. Economic Record, 88(S1), 2–9. https://doi.org/10.1111/j.1475-4932.2012.00809.x
Da, Z., Engelberg, J., & Gao, P. (2011). In search of attention. Journal of Finance, 66(5), 1461–1499. https://doi.org/10.1111/j.1540-6261.2011.01679.x
Ginsberg, J., Mohebbi, M. H., Patel, R. S., Brammer, L., Smolinski, M. S., & Brilliant, L. (2009). Detecting influenza epidemics using search engine query data. Nature, 457(7232), 1012–1014. https://doi.org/10.1038/nature07634
Goel, S., Hofman, J. M., Lahaie, S., Pennock, D. M., & Watts, D. J. (2010). Predicting consumer behavior with Web search. Proceedings of the National Academy of Sciences, 107(41), 17486–17490. https://doi.org/10.1073/pnas.1005962107
Hyndman, R. J., & Athanasopoulos, G. (2021). Forecasting: Principles and practice (3rd ed.). OTexts.
Lazer, D., Kennedy, R., King, G., & Vespignani, A. (2014). The parable of Google Flu: Traps in big data analysis. Science, 343(6176), 1203–1205. https://doi.org/10.1126/science.1248506
Mavragani, A., Ochoa, G., & Tsagarakis, K. P. (2018). Assessing the methods, tools, and statistical approaches in Google Trends research: Systematic review. Journal of Medical Internet Research, 20(11), Article e270. https://doi.org/10.2196/jmir.9366
Preis, T., Moat, H. S., & Stanley, H. E. (2013). Quantifying trading behavior in financial markets using Google Trends. Scientific Reports, 3, Article 1684. https://doi.org/10.1038/srep01684
Salganik, M. J. (2018). Bit by bit: Social research in the digital age. Princeton University Press.
Scott, S. L., & Varian, H. R. (2014). Predicting the present with Bayesian structural time series. International Journal of Mathematical Modelling and Numerical Optimisation, 5(1–2), 4–23. https://doi.org/10.1504/IJMMNO.2014.059942
Stephens-Davidowitz, S. (2014). The cost of racial animus on a black candidate: Evidence using Google search data. Journal of Public Economics, 118, 26–40. https://doi.org/10.1016/j.jpubeco.2014.04.010
Wu, L., & Brynjolfsson, E. (2015). The future of prediction: How Google searches foreshadow housing prices and sales. In A. Goldfarb, S. M. Greenstein, & C. E. Tucker (Eds.), Economic analysis of the digital economy (pp. 89–118). University of Chicago Press.