
Intelligence · Concepts and history
Geospatial Intelligence (GEOINT): Earth Observation and Environmental Knowledge
Geospatial intelligence combines imagery, maps and location data to show what is happening where. This article traces its history from cholera maps and spy satellites to free global imagery and machine learning, and explains how businesses, governments and researchers now use it.
Almost everything that matters to a government or a business happens somewhere. Crops grow in particular fields, ships follow particular routes, customers live in particular neighbourhoods and floods strike particular towns. Geospatial intelligence, usually shortened to GEOINT, is the discipline of collecting and analysing information about the Earth's surface and the activities on it, so that decision-makers can see what is happening where and how it is changing. Once the preserve of national security agencies with expensive satellites, it has become one of the most widely available forms of intelligence, thanks to free imagery, cheap drones, mobile location data and machine learning. This article explains what geospatial intelligence is, traces its history, describes its main sources and methods, and shows how it is used to generate environmental and economic knowledge.
What geospatial intelligence is
In national security practice, geospatial intelligence brings together imagery, imagery intelligence (the interpretation of what images show) and geospatial information such as maps, elevation models and the coordinates of features. Lowenthal and Clark (2016) treat it as one of the five main collection disciplines, alongside human, signals, measurement and signature, and open-source intelligence. American law defines it in similar terms, as the exploitation and analysis of imagery and geospatial information to describe, assess and visually depict physical features and geographically referenced activities on the Earth.
Outside government the same activities go under names such as geographic information science, remote sensing, location analytics and Earth observation. Longley et al. (2015) describe the underlying science: how spatial data are captured, represented in geographic information systems (GIS), analysed and displayed. The common thread is the use of location as the key that links otherwise separate pieces of information.
A principle stated by the geographer Waldo Tobler explains why location is so powerful. Tobler's "first law of geography" holds that everything is related to everything else, but near things are more related than distant things (Tobler, 1970). Because nearby places tend to resemble each other, knowing where something is allows analysts to connect it with what else is nearby, to fill gaps by interpolation and to detect places that do not fit the pattern.
Origins: from cholera maps to spy satellites
Spatial analysis for decision-making long predates satellites. In 1854 the London physician John Snow mapped deaths during a cholera outbreak in Soho and showed that they clustered around a public water pump on Broad Street. Snow's analysis, published in the expanded edition of a study of cholera transmission (Snow, 1855), is often cited as an early example of using a map to test a hypothesis and guide action: the pump's handle was removed.
Aerial photography transformed military intelligence in the First and Second World Wars, and the Cold War made overhead imagery central to national security. American U-2 aircraft flew over the Soviet Union from 1956, and in October 1962 U-2 photographs revealed Soviet medium-range missile sites under construction in Cuba. Brugioni (1991), one of the photo-interpreters involved, describes how analysts identified the missile sites by comparing the patterns of equipment and earthworks with those seen at known Soviet sites, an early example of pattern-based imagery analysis.
Satellites soon followed. The Corona programme, operated by the United States from 1960 to 1972, returned film from orbit in capsules caught in mid-air. Day et al. (1998), drawing on documents declassified in 1995, describe how its first successful mission in August 1960 produced more coverage of the Soviet Union than all previous U-2 flights combined, ending years of uncertainty about the size of Soviet missile forces.
The civilian Earth observation revolution
While military satellites remained secret, civilian Earth observation grew in parallel. The first Landsat satellite was launched in 1972, beginning what is now the longest continuous record of the Earth's land surface from space. Wulder et al. (2019) describe how the decision in 2008 to make the entire Landsat archive available free of charge transformed its use: downloads rose from thousands to millions of scenes, and scientists, governments and companies began analysing change across whole continents and decades.
Europe's Copernicus programme added the Sentinel satellites. Sentinel-2, described by Drusch et al. (2012), provides multispectral images at up to 10-metre resolution, revisiting each location every five days with two satellites, and its data are also free. Belward and Skøien (2015) document the rapid growth in the number of civilian Earth observation satellites and in the number of countries launching them, which has made imagery far more plentiful and diverse than at any time in the past.
Commercial operators now offer imagery with sub-metre resolution and constellations of small satellites that image much of the Earth's land surface every day. Synthetic aperture radar, which uses microwave signals and can see through cloud and at night, adds another layer; Moreira et al. (2013) explain how radar imaging works and how it detects changes in surface height and structure that optical images miss. Hyperspectral sensors, which record hundreds of narrow wavelength bands, can identify materials such as minerals, crop types and pollutants by their spectral signatures (Goetz et al., 1985).
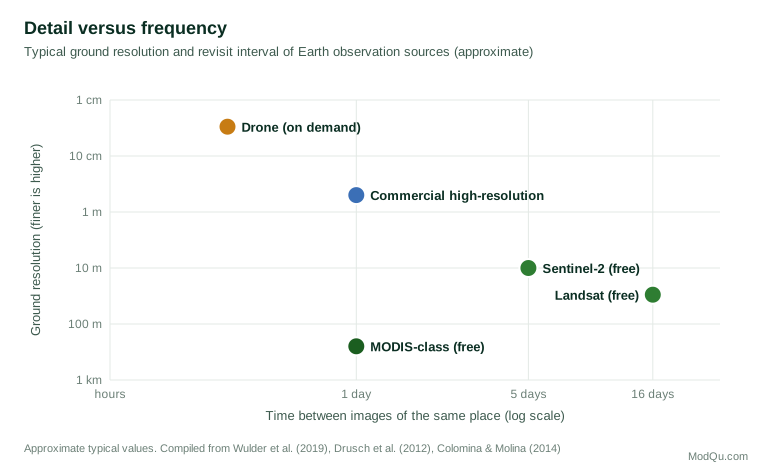
Drones fill the gap at the finest scale. Colomina and Molina (2014) review how small unmanned aircraft are used for photogrammetry and remote sensing, producing centimetre-level images and three-dimensional models of construction sites, farms, mines and disaster zones at low cost and on demand.
People as sensors
Not all geospatial information comes from above. Mobile phones, vehicles, payment cards and connected devices generate enormous volumes of location records, and people deliberately contribute place-based information through mapping projects, reviews and social media. Goodchild (2007) argued that this turns billions of people into "sensors" who observe and report on their surroundings, producing geographic information that is more current and more detailed in some respects than official maps.
These human sources complement imagery well. A satellite can show that a car park is full; location data can show where the cars came from. A map built by volunteers after an earthquake can show which roads are blocked before official surveys arrive. For businesses, aggregated and anonymised movement data reveal how customers travel between home, work and shops, how footfall changes after a competitor opens nearby, and which neighbourhoods are growing. The same data raise serious privacy questions, discussed below, because location records are highly revealing about individuals even when names are removed.
Planning a geospatial question
As with other forms of intelligence, the most common mistake is to start with the data rather than the question. A well-planned geospatial analysis works through a series of choices:
- What exactly must be detected or measured? A new building, a change in crop health, the number of vehicles, the extent of a flood. The answer sets the required resolution: detecting cars needs sub-metre imagery, while mapping forest loss across a country can use 30-metre data.
- How often must it be observed? Weekly monitoring of a port needs frequent revisits; annual mapping of land use does not. Cloud cover matters, so radar may be needed in cloudy regions.
- What period of history is needed? Measuring change requires a baseline. Long free archives such as Landsat allow comparisons over decades; newer commercial data may go back only a few years.
- What ground truth is available? Field visits, surveys or trusted local records are needed to check what the imagery shows and to train classification models.
- What will be done with the answer? A one-off report, a dashboard updated monthly or an alert that fires when a change is detected each demand different processing and delivery.
Working through these questions often shows that free data are sufficient, or that a modest purchase of high-resolution images for a few key sites will answer the question better than a large general purchase.
Analysis: from pictures to knowledge
Imagery alone is not intelligence. The value comes from analysis that turns pixels into measurements, classifications and judgements.
Change detection. Comparing images of the same place over time reveals construction, deforestation, flooding, crop growth and the movement of equipment. Long archives such as Landsat's make it possible to measure change over decades.
Classification. Algorithms assign each pixel or object to a category such as forest, water, cropland or building. Zhu et al. (2017) review how deep learning has dramatically improved the accuracy of such classifications and enabled the automatic detection of objects such as vehicles, ships and buildings.
Spatial statistics. Analysts test whether events cluster more than chance would predict and where the clusters are. Anselin (1995) introduced local indicators of spatial association, widely used to identify hot spots and outliers in crime, disease and economic data.
Fusion with other data. Geospatial intelligence is most powerful when location links imagery with other sources: business registers, transport records, survey results or social media posts. Goodchild (2007) described the rise of volunteered geographic information, in which millions of individuals contribute location data through mapping projects and mobile devices, creating a new and rapidly updated layer of human geography.
Cloud platforms have made this analysis accessible beyond specialist agencies. Gorelick et al. (2017) describe Google Earth Engine, which hosts petabytes of public satellite imagery alongside computing power, allowing researchers to analyse the whole planet without downloading data.
Environmental knowledge
Earth observation has produced some of the most important environmental knowledge of recent decades.
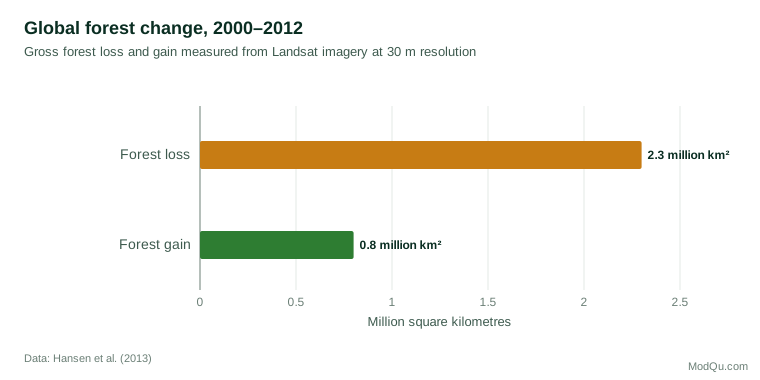
Hansen et al. (2013) used Landsat imagery to map global forest change at 30-metre resolution from 2000 to 2012. They found a gross loss of about 2.3 million square kilometres of forest and a gain of about 0.8 million square kilometres over the period, with the tropics showing the largest losses. The maps, updated annually since, are used by governments, companies and campaigners to monitor deforestation in supply chains and enforce protected areas.
Pekel et al. (2016) analysed more than three decades of Landsat images to map where surface water had appeared and disappeared around the world. They found that permanent water had disappeared from large areas, often because of drought and water extraction, while new permanent water bodies had formed elsewhere, mainly through reservoir construction. Such analyses would have been impossible without both a long free archive and cloud computing.
Economic and social knowledge
Satellite data have also become a source of economic intelligence. Henderson et al. (2012) showed that the intensity of night-time lights seen from space tracks economic activity and can improve estimates of growth in countries with weak official statistics. Donaldson and Storeygard (2016) review the many uses of satellite data in economics, from measuring urban expansion and crop yields to estimating the effects of roads and pollution.
Jean et al. (2016) combined daytime satellite images with machine learning to estimate household consumption and assets in several African countries, using survey data to train the model. Their approach predicted local poverty levels more accurately than night lights alone, suggesting a way to map poverty in places where surveys are rare. Burke et al. (2021) review this growing field and conclude that satellite-based measurement can substantially improve monitoring of sustainable development goals, while warning that models must be validated against ground data and that errors may be larger in some places than others.
Illustration: monitoring a supplier
A food company that has committed to deforestation-free supply chains buys palm oil through several mills in Southeast Asia. Its sustainability team uses geospatial intelligence in three steps. First, it maps the area from which each mill is likely to draw fruit, using road networks and typical transport distances. Second, it overlays annual forest-loss maps derived from Landsat, together with more frequent alerts from radar and Sentinel-2 imagery, to see where forest has been cleared within those areas since the company's cut-off date. Third, where clearing is detected, it orders higher-resolution images of the specific locations and asks the supplier for an explanation, sometimes followed by a field visit.
The result is not certainty. A cleared area may belong to a smallholder who does not supply that mill, or the clearing may have been legal. But the company can focus its limited audit capacity on the places with the strongest signals, check suppliers' claims independently and report progress with evidence rather than assurances. This pattern, broad and cheap screening followed by targeted high-resolution checks and human follow-up, is typical of good geospatial intelligence practice.
Accuracy and uncertainty
Maps produced from imagery look authoritative, but every classification has errors. A pixel labelled "forest" may be a plantation; a building may be missed because it is under trees. Good practice is to report accuracy alongside the map: what proportion of a sample of locations, checked on the ground or in higher-resolution images, was classified correctly, and which categories were most often confused. Area estimates should account for these errors rather than simply counting labelled pixels. Analysts should also state the date of the imagery, because a map of last year's conditions may be presented, and read, as if it showed today.
Business uses
Businesses now use geospatial intelligence for many purposes:
- Site selection and market analysis: combining population, income, competitor locations and travel times to choose store or warehouse locations.
- Supply chain monitoring: watching ports, mines, farms and factories from space to anticipate disruptions or verify suppliers' claims, including about deforestation.
- Agriculture and commodities: estimating crop conditions and yields before official statistics are published.
- Insurance and risk: mapping exposure to floods, wildfires and storms and assessing damage quickly after disasters.
- Infrastructure and construction: measuring progress and detecting ground movement with drones and radar.
Clark (2020) observes that geospatial intelligence is especially valuable when it supports a model of a target, such as a competitor's network of facilities, because location connects facts that would otherwise remain unrelated.
Limits and cautions
Geospatial intelligence is powerful but not infallible. Images show what is visible from above, not intentions or what happens inside buildings. Clouds, shadows and the time of day affect what can be seen. Classification models trained in one region may perform poorly in another, and errors in automated detection can be systematic rather than random. Burke et al. (2021) stress the need for ground truth, including surveys and field checks, to validate satellite-based estimates.
There are also ethical and legal questions. Very high resolution imagery and mobile location data can reveal private activities, and the same tools that monitor deforestation can be used for surveillance. Lowenthal (2022) notes that the spread of commercial imagery has eroded the monopoly governments once held, with consequences for both transparency and security. Organisations using geospatial data should respect privacy law, avoid identifying individuals unless lawfully justified, and be transparent about their methods.
Conclusion
Geospatial intelligence has travelled from Snow's hand-drawn map to planetary-scale analysis in the cloud. Its essential idea has not changed: placing information on a map reveals relationships that are otherwise invisible. What has changed is access. Free satellite archives, commercial constellations, drones, open data and machine learning have put capabilities once reserved for superpowers within reach of researchers, companies and citizens. Used carefully, combined with surveys and ground truth, and with respect for privacy, geospatial intelligence is one of the most productive sources of environmental and economic knowledge available today.
References
Anselin, L. (1995). Local indicators of spatial association—LISA. Geographical Analysis, 27(2), 93–115. https://doi.org/10.1111/j.1538-4632.1995.tb00338.x
Belward, A. S., & Skøien, J. O. (2015). Who launched what, when and why: Trends in global land-cover observation capacity from civilian earth observation satellites. ISPRS Journal of Photogrammetry and Remote Sensing, 103, 115–128. https://doi.org/10.1016/j.isprsjprs.2014.03.009
Brugioni, D. A. (1991). Eyeball to eyeball: The inside story of the Cuban missile crisis. Random House.
Burke, M., Driscoll, A., Lobell, D. B., & Ermon, S. (2021). Using satellite imagery to understand and promote sustainable development. Science, 371(6535), Article eabe8628. https://doi.org/10.1126/science.abe8628
Clark, R. M. (2020). Intelligence analysis: A target-centric approach (6th ed.). CQ Press.
Colomina, I., & Molina, P. (2014). Unmanned aerial systems for photogrammetry and remote sensing: A review. ISPRS Journal of Photogrammetry and Remote Sensing, 92, 79–97. https://doi.org/10.1016/j.isprsjprs.2014.02.013
Day, D. A., Logsdon, J. M., & Latell, B. (Eds.). (1998). Eye in the sky: The story of the Corona spy satellites. Smithsonian Institution Press.
Donaldson, D., & Storeygard, A. (2016). The view from above: Applications of satellite data in economics. Journal of Economic Perspectives, 30(4), 171–198. https://doi.org/10.1257/jep.30.4.171
Drusch, M., Del Bello, U., Carlier, S., Colin, O., Fernandez, V., Gascon, F., Hoersch, B., Isola, C., Laberinti, P., Martimort, P., Meygret, A., Spoto, F., Sy, O., Marchese, F., & Bargellini, P. (2012). Sentinel-2: ESA's optical high-resolution mission for GMES operational services. Remote Sensing of Environment, 120, 25–36. https://doi.org/10.1016/j.rse.2011.11.026
Goetz, A. F. H., Vane, G., Solomon, J. E., & Rock, B. N. (1985). Imaging spectrometry for Earth remote sensing. Science, 228(4704), 1147–1153. https://doi.org/10.1126/science.228.4704.1147
Goodchild, M. F. (2007). Citizens as sensors: The world of volunteered geography. GeoJournal, 69(4), 211–221. https://doi.org/10.1007/s10708-007-9111-y
Gorelick, N., Hancher, M., Dixon, M., Ilyushchenko, S., Thau, D., & Moore, R. (2017). Google Earth Engine: Planetary-scale geospatial analysis for everyone. Remote Sensing of Environment, 202, 18–27. https://doi.org/10.1016/j.rse.2017.06.031
Hansen, M. C., Potapov, P. V., Moore, R., Hancher, M., Turubanova, S. A., Tyukavina, A., Thau, D., Stehman, S. V., Goetz, S. J., Loveland, T. R., Kommareddy, A., Egorov, A., Chini, L., Justice, C. O., & Townshend, J. R. G. (2013). High-resolution global maps of 21st-century forest cover change. Science, 342(6160), 850–853. https://doi.org/10.1126/science.1244693
Henderson, J. V., Storeygard, A., & Weil, D. N. (2012). Measuring economic growth from outer space. American Economic Review, 102(2), 994–1028. https://doi.org/10.1257/aer.102.2.994
Jean, N., Burke, M., Xie, M., Davis, W. M., Lobell, D. B., & Ermon, S. (2016). Combining satellite imagery and machine learning to predict poverty. Science, 353(6301), 790–794. https://doi.org/10.1126/science.aaf7894
Longley, P. A., Goodchild, M. F., Maguire, D. J., & Rhind, D. W. (2015). Geographic information science and systems (4th ed.). Wiley.
Lowenthal, M. M., & Clark, R. M. (Eds.). (2016). The five disciplines of intelligence collection. CQ Press.
Lowenthal, M. M. (2022). Intelligence: From secrets to policy (9th ed.). CQ Press.
Moreira, A., Prats-Iraola, P., Younis, M., Krieger, G., Hajnsek, I., & Papathanassiou, K. P. (2013). A tutorial on synthetic aperture radar. IEEE Geoscience and Remote Sensing Magazine, 1(1), 6–43. https://doi.org/10.1109/MGRS.2013.2248301
Pekel, J.-F., Cottam, A., Gorelick, N., & Belward, A. S. (2016). High-resolution mapping of global surface water and its long-term changes. Nature, 540(7633), 418–422. https://doi.org/10.1038/nature20584
Snow, J. (1855). On the mode of communication of cholera (2nd ed.). John Churchill.
Tobler, W. R. (1970). A computer movie simulating urban growth in the Detroit region. Economic Geography, 46(Suppl. 1), 234–240. https://doi.org/10.2307/143141
Wulder, M. A., Loveland, T. R., Roy, D. P., Crawford, C. J., Masek, J. G., Woodcock, C. E., Allen, R. G., Anderson, M. C., Belward, A. S., Cohen, W. B., Dwyer, J., Erb, A., Gao, F., Griffiths, P., Helder, D., Hermosilla, T., Hipple, J. D., Hostert, P., Hughes, M. J., ... Zhu, Z. (2019). Current status of Landsat program, science, and applications. Remote Sensing of Environment, 225, 127–147. https://doi.org/10.1016/j.rse.2019.02.015
Zhu, X. X., Tuia, D., Mou, L., Xia, G.-S., Zhang, L., Xu, F., & Fraundorfer, F. (2017). Deep learning in remote sensing: A comprehensive review and list of resources. IEEE Geoscience and Remote Sensing Magazine, 5(4), 8–36. https://doi.org/10.1109/MGRS.2017.2762307