
Intelligence · Concepts and history
A History of Business Intelligence From Ledgers to Dashboards
Business intelligence did not begin with software. This article traces how firms have gathered and used information to decide, from merchant ledgers and telegraph news to data warehouses, dashboards and today's self-service analytics.
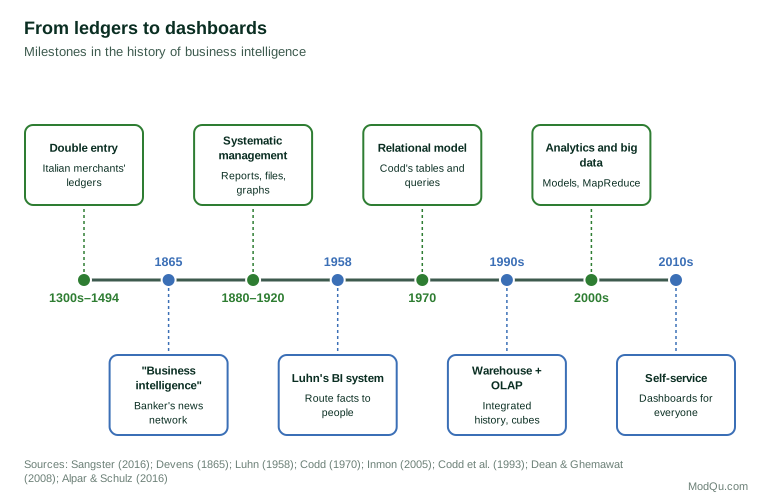
Today "business intelligence" usually means software: dashboards, reports and data warehouses that let managers see sales, costs and customer behaviour at a glance. The idea is much older than the technology. For as long as merchants have traded, they have tried to know more, and know it sooner, than their rivals. This article traces the history of business intelligence through six broad periods, from the merchant's ledger to the self-service dashboard, and draws out the lessons each period offers for organisations today.
1. Ledgers and letters: the merchant's intelligence
The first business intelligence systems were account books and letters. Merchants in the Italian trading cities of the late Middle Ages developed double-entry bookkeeping, which recorded every transaction twice, as a debit and a credit, so that errors could be detected and the state of a business could be known at any time. Sangster (2016) traces how the method emerged among Italian merchants long before Luca Pacioli's printed description of it in 1494, and argues that its spread owed much to the practical needs of trade and to the teaching of commercial arithmetic.
A ledger told merchants about their own business. Knowledge of the outside world came through correspondence. Trading houses maintained networks of agents who wrote regularly about prices, harvests, shipping, wars and the creditworthiness of other merchants. The value of such information depended on speed: a merchant who learned of a price change before others could buy or sell at an advantage.
The phrase "business intelligence" appears in this sense in a nineteenth-century anthology of commercial stories. Devens (1865) describes how the banker Sir Henry Furnese gained an advantage over competitors by maintaining a network of correspondents across Europe who sent early news of political and military events, allowing Furnese to act on it before others could. The story captures the original meaning of the term: timely knowledge of the environment, used for profit.
2. Systematic management: forms, files and graphs
The industrial corporations of the late nineteenth and early twentieth centuries created a new problem. Railways, steel makers and manufacturing firms grew so large and complex that owners could no longer see their operations directly. Chandler (1977) shows how these firms developed hierarchies of salaried managers who coordinated activity through regular flows of reports and statistics. The "visible hand" of management replaced the market in coordinating much economic activity, and it depended on information.
Yates (1989) documents how American firms between 1850 and 1920 developed the tools of systematic management: standard forms, carbon copies, vertical filing cabinets, circular letters and, notably, graphs and tables that summarised operating data for senior managers. Internal communication became a deliberate instrument of control. Many features of modern business intelligence, including routine reports, standard measures and visual summaries for executives, have their roots in this period.
3. Early computing: Luhn's vision and management information systems
The first computers in business were used for accounting and payroll, but some researchers saw a larger role. Luhn (1958), working at IBM, published a paper titled "A Business Intelligence System" that described automatic methods for abstracting documents, building profiles of the interests of each person in an organisation and sending relevant information to them. Luhn defined intelligence as "the ability to apprehend the interrelationships of presented facts in such a way as to guide action towards a desired goal." Luhn's system was never built as described, but the emphasis on routing the right information to the right person anticipated much later work.
In the 1960s, large firms began building management information systems (MIS) that produced regular printed reports from transaction data. The results were often disappointing. Ackoff (1967), in a widely cited critique titled "Management Misinformation Systems", argued that designers wrongly assumed managers suffered from a lack of relevant information, when in fact they suffered more from an overabundance of irrelevant information. More data, Ackoff warned, did not produce better decisions unless systems were designed around how managers actually decided.
Researchers responded by focusing on decisions rather than reports. Gorry and Scott Morton (1971) proposed a framework that distinguished structured, semi-structured and unstructured decisions, and coined the term decision support systems for interactive tools that helped managers with semi-structured problems. Power (2008) traces how decision support systems developed through the 1970s and 1980s into model-driven, data-driven and communication-driven forms. Rockart (1979) introduced the critical success factors method, in which executives identify the small number of areas where results must go well and information systems are designed to report on them. This idea later shaped executive information systems and the key performance indicators of modern dashboards.
4. Relational databases, warehouses and OLAP
Two technical developments made modern business intelligence possible. The first was the relational database. Codd (1970) proposed organising data in tables of rows and columns, related through shared keys and queried through a mathematical language, so that users could ask questions without knowing how the data were physically stored. Relational databases became the standard for business transaction systems during the 1980s.
The second was the data warehouse. Transaction systems were designed to record sales, orders and payments quickly, not to answer analytical questions across years of history. Running large analytical queries against them slowed operations and produced inconsistent answers, because different systems defined customers, products and regions differently. Inmon (2005) defined the data warehouse as a subject-oriented, integrated, time-variant and non-volatile collection of data in support of management's decisions. Data from operational systems would be extracted, cleaned and loaded into a separate store designed for analysis. Kimball and Ross (2013) developed the complementary method of dimensional modelling, in which data are organised into fact tables (such as sales) surrounded by dimension tables (such as date, product, customer and store), a structure that business users found intuitive.
Codd et al. (1993) introduced the term online analytical processing (OLAP) for tools that allowed users to explore multidimensional data interactively, slicing, dicing, drilling down and rolling up through hierarchies such as year, quarter and month. Chaudhuri and Dayal (1997) summarised the resulting architecture of warehouse, OLAP server and front-end tools, which became standard in large organisations by the end of the 1990s. It was in this period that the term "business intelligence" came into general commercial use as an umbrella for these technologies.
5. Analytics and big data
By the 2000s most large firms had data warehouses and reporting tools. Watson and Wixom (2007) described business intelligence as two activities: getting data in, through warehousing, and getting data out, through reports, OLAP, dashboards and analytics. Negash (2004) characterised business intelligence systems as combining data gathering, storage and knowledge management with analytical tools to present complex information to planners and decision-makers.
Davenport (2006) argued that a new kind of competitor had emerged: firms that competed on analytics, using statistical models and experiments to make decisions about pricing, marketing, logistics and customer service. Business intelligence was no longer only about reporting what had happened; it increasingly sought to predict and optimise.
At the same time, the volume and variety of data exploded. Web clicks, search queries, social media posts, mobile locations and sensor readings could not be handled easily by traditional warehouses. Dean and Ghemawat (2008) described MapReduce, a programming model developed at Google for processing very large datasets across clusters of ordinary computers, which inspired open-source tools that made large-scale processing affordable for other firms. Chen et al. (2012) described the evolution in three stages: a first generation of business intelligence and analytics based on structured data in relational databases; a second based on web and unstructured content such as text; and a third based on mobile and sensor data.
6. Dashboards and self-service
The most visible change for ordinary users was the dashboard. Few (2006) defined a dashboard as a visual display of the most important information needed to achieve one or more objectives, consolidated on a single screen so it can be monitored at a glance. Few also criticised the many dashboards that favoured decoration, gauges and three-dimensional charts over clear communication, and set out design principles that have been widely adopted.
From the late 2000s, a new generation of desktop and cloud tools allowed business users to connect to data, build charts and share dashboards without waiting for a central technical team. Alpar and Schulz (2016) describe this self-service business intelligence as a shift in which users take on tasks previously performed by specialists, and note that it raises new challenges of data governance, consistency and skill.
The other side of the story: external intelligence
While internal reporting systems grew, a separate tradition of outward-looking intelligence developed in marketing and strategy departments. Market research firms began measuring consumer behaviour systematically in the early twentieth century, and by mid-century large companies were buying syndicated data on retail sales, advertising and audiences. Competitive intelligence emerged as a recognised function in the 1980s, as firms began to collect and analyse information about rivals' products, prices, plans and capabilities in a structured way.
For most of the twentieth century these two traditions, internal reporting and external market and competitor intelligence, lived in different parts of the organisation and used different tools. Finance and operations owned the warehouse and the reports; marketing and strategy owned the surveys and competitor files. One of the quiet achievements of recent decades has been to bring them closer together, so that a manager looking at falling sales in a region can also see survey evidence on customer satisfaction and information about a competitor's new store opening. The integration is still incomplete in many firms, and it remains one of the most valuable improvements a business intelligence programme can make.
What changed and what did not
It is tempting to see the history of business intelligence as a story of steady technical progress. In one sense it is: each generation could store more data, process it faster and display it more clearly than the last. In another sense the central problems have barely changed. Managers in 1900, 1970 and today have all complained of receiving too many reports and too little insight. Data definitions have been disputed in every era. And the most valuable information, about customers' intentions, competitors' plans and shifts in the wider environment, has always been harder to capture than the record of past transactions.
Lessons from the history
Looking across six centuries, several themes recur.
Speed has always mattered. From Devens's banker to real-time dashboards, the value of business intelligence has depended on knowing sooner than others. Each new technology, from the telegraph to streaming data, has shortened the interval between an event and the decision it informs.
More data is not the same as better intelligence. Ackoff's warning about misinformation systems has been repeated in every generation. The data warehouse, big data and self-service tools each promised better decisions; each delivered them only where organisations were clear about the questions they needed to answer.
Integration is the hard part. Much of the effort in business intelligence history has gone into reconciling data from different sources: different ledgers, different reports, different systems. The data warehouse was above all an integration project, and the same problem reappears with every new source of data.
Design for decisions. Gorry and Scott Morton (1971) and Rockart (1979) argued that information systems should be built around the decisions managers make and the factors that determine success. This principle remains the best guide to designing a useful dashboard.
Internal and external intelligence diverged and need reconnecting. The original meaning of business intelligence, as in Devens (1865), concerned knowledge of the outside world: markets, rivals, politics. Over the twentieth century, the term came to mean mainly internal reporting. Modern firms increasingly need both, combining their own data with market research, competitor analysis and public information to understand not just what they did but why, and what is likely to happen next.
The tools will keep changing. The underlying task, turning information into timely understanding that guides action, is the one Luhn described in 1958 and Furnese practised a century and a half before that.
References
Ackoff, R. L. (1967). Management misinformation systems. Management Science, 14(4), B147–B156. https://doi.org/10.1287/mnsc.14.4.B147
Alpar, P., & Schulz, M. (2016). Self-service business intelligence. Business & Information Systems Engineering, 58(2), 151–155. https://doi.org/10.1007/s12599-016-0424-6
Chandler, A. D., Jr. (1977). The visible hand: The managerial revolution in American business. Belknap Press of Harvard University Press.
Chaudhuri, S., & Dayal, U. (1997). An overview of data warehousing and OLAP technology. ACM SIGMOD Record, 26(1), 65–74. https://doi.org/10.1145/248603.248616
Chen, H., Chiang, R. H. L., & Storey, V. C. (2012). Business intelligence and analytics: From big data to big impact. MIS Quarterly, 36(4), 1165–1188. https://doi.org/10.2307/41703503
Codd, E. F. (1970). A relational model of data for large shared data banks. Communications of the ACM, 13(6), 377–387. https://doi.org/10.1145/362384.362685
Codd, E. F., Codd, S. B., & Salley, C. T. (1993). Providing OLAP (on-line analytical processing) to user-analysts: An IT mandate. Codd & Date.
Davenport, T. H. (2006). Competing on analytics. Harvard Business Review, 84(1), 98–107.
Dean, J., & Ghemawat, S. (2008). MapReduce: Simplified data processing on large clusters. Communications of the ACM, 51(1), 107–113. https://doi.org/10.1145/1327452.1327492
Devens, R. M. (1865). Cyclopaedia of commercial and business anecdotes. D. Appleton and Company.
Few, S. (2006). Information dashboard design: The effective visual communication of data. O'Reilly Media.
Gorry, G. A., & Scott Morton, M. S. (1971). A framework for management information systems. Sloan Management Review, 13(1), 55–70.
Inmon, W. H. (2005). Building the data warehouse (4th ed.). Wiley.
Kimball, R., & Ross, M. (2013). The data warehouse toolkit: The definitive guide to dimensional modeling (3rd ed.). Wiley.
Luhn, H. P. (1958). A business intelligence system. IBM Journal of Research and Development, 2(4), 314–319. https://doi.org/10.1147/rd.24.0314
Negash, S. (2004). Business intelligence. Communications of the Association for Information Systems, 13, 177–195. https://doi.org/10.17705/1CAIS.01315
Power, D. J. (2008). Decision support systems: A historical overview. In F. Burstein & C. W. Holsapple (Eds.), Handbook on decision support systems 1 (pp. 121–140). Springer. https://doi.org/10.1007/978-3-540-48713-5_7
Rockart, J. F. (1979). Chief executives define their own data needs. Harvard Business Review, 57(2), 81–93.
Sangster, A. (2016). The genesis of double entry bookkeeping. The Accounting Review, 91(1), 299–315. https://doi.org/10.2308/accr-51115
Watson, H. J., & Wixom, B. H. (2007). The current state of business intelligence. Computer, 40(9), 96–99. https://doi.org/10.1109/MC.2007.331
Yates, J. (1989). Control through communication: The rise of system in American management. Johns Hopkins University Press.