
Insights · Insight quality and pitfalls
The Illusion of Insight: Apophenia and False Knowledge Generation in Big Data
Why people and analytical systems see meaningful patterns in random data, why large datasets make spurious findings more common rather than less, and the practical checks that separate real insight from patterns produced by chance.
Human beings are very good at finding patterns. This ability helps us learn quickly from experience, but it has a cost: we also see patterns where none exist. Large datasets and powerful analytical tools do not remove this problem. In some ways they make it worse, because the more data and the more comparisons an analyst makes, the more chance patterns there are to find. This article explains the tendency to see meaning in randomness, why big data multiplies false discoveries, and how insight teams can guard against them.
Seeing patterns in noise
The term apophenia was introduced by the psychiatrist Klaus Conrad (1958) to describe the experience, in the early stages of psychosis, of seeing meaningful connections between unrelated events. It is now used more broadly for the ordinary tendency to perceive meaning in random or meaningless data. Shermer (2008) called the same tendency "patternicity" and argued that it is a normal feature of human cognition.
There are good reasons why this tendency evolved. Foster and Kokko (2009) used a mathematical model to show that natural selection can favour beliefs in causal links that do not exist, when the cost of wrongly believing in a link is lower than the cost of missing a real one. Rustling grass may usually be the wind, but treating it as a predator is the safer mistake.
The tendency appears in everyday judgement. Gilovich et al. (1985) studied the belief that basketball players have a "hot hand", a higher chance of scoring after scoring, and found that in their data successive shots were largely independent, while players and fans firmly believed otherwise. Later research using larger data and different methods has found evidence of a small hot-hand effect, but the original study remains a clear illustration of how strongly people expect random sequences to look less streaky than they do. Whitson and Galinsky (2008) found that people who were made to feel a lack of control were more likely to see patterns in random images and to perceive illusory connections between events, which suggests that the pressure to explain uncertain business results may itself increase false pattern detection.
Why more data can mean more false insight
It is often assumed that larger datasets produce more reliable knowledge. For estimating a single, pre-specified quantity, that is true. But large datasets usually contain many variables, and analysts look for relationships among them. The number of possible relationships grows much faster than the number of variables.
If an analyst tests every pair of variables for a correlation at the conventional 5% significance level, about one in twenty pairs of unrelated variables will appear related by chance. With 10 variables there are 45 pairs, so about two chance findings are expected. With 100 variables there are 4,950 pairs, and about 250 chance findings are expected, even if no real relationships exist.
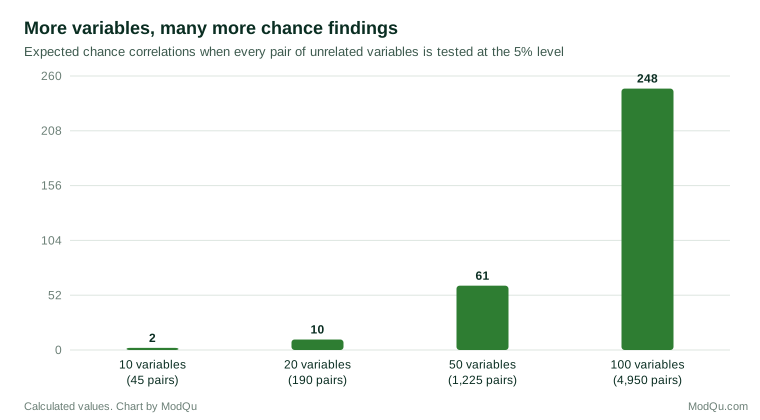
Calude and Longo (2017) used results from mathematics to show that sufficiently large databases must contain arbitrary correlations, which arise from the size of the data rather than from anything real. Their argument is a response to claims, such as Anderson's (2008), that with enough data, correlation is sufficient and theory is no longer needed. boyd and Crawford (2012) made a related point, arguing that big data does not speak for itself, that its patterns require interpretation, and that claims of objectivity often hide choices about what was measured and how.
A memorable demonstration came from a neuroimaging study by Bennett et al. (2010), who scanned a dead salmon while showing it photographs of people and found apparent brain activity, an artefact that disappeared once the analysis corrected for the very large number of comparisons made. Vigen (2015) collected many striking correlations between unrelated series, such as the consumption of a food and the number of people who died in a particular way, each produced simply by searching many data series for matching trends.
The analyst's freedom
False insights also come from the many choices analysts make. Simmons et al. (2011) showed that flexibility in deciding which data to collect, which observations to exclude, which variables to control for and which comparisons to report can greatly increase the chance of finding a statistically significant result when no effect exists. Gelman and Loken (2014) pointed out that this problem arises even when analysts do not deliberately try many analyses, because the choice of analysis is often shaped by the data already seen, a situation they described as a "garden of forking paths". Ioannidis (2005) argued that when many relationships are tested, effects are small and flexibility is high, a large share of claimed findings are likely to be false.
Big data in practice
Lazer et al. (2014) described how a model that estimated influenza levels from internet searches initially appeared highly accurate but later overestimated influenza substantially. One reason was that it had been built by selecting, from a very large number of search terms, those that happened to match past influenza data, some of which were related to seasonal patterns rather than to illness itself.
An example
Consider a hypothetical subscription business that asks its analysts to explain why some customers cancel. The team takes a dataset of 80 customer attributes, from age and region to the day of the week on which each customer signed up, and tests every attribute against cancellation. Several emerge as significant. One finding stands out: customers who joined on a Tuesday cancel at a noticeably higher rate. A story quickly forms around it, involving a mid-week promotion that attracted less committed customers, and a proposal is drafted to change the timing of promotions.
Before acting, the team checks the finding against a second year of data that was not used in the search. The Tuesday effect disappears. So do most of the other significant attributes, except two that had a clear explanation from the start: customers on the cheapest plan and customers who never set up the product's main feature cancel more often. With 80 attributes tested, a handful of chance results was to be expected. The story about promotions was apophenia supported by a plausible narrative, and the hold-out check prevented a decision based on noise.
Guarding against false insight
Several practices help separate real insight from patterns produced by chance:
- State the question first. Decide which relationships to test before looking at the data, and record the plan.
- Correct for multiple comparisons. When many tests are run, use methods that control the overall rate of false discoveries. Benjamini and Hochberg (1995) proposed a widely used method for controlling the false discovery rate.
- Hold data back. Find patterns in one part of the data and confirm them in another part not used in the search.
- Ask for a mechanism. A pattern with a plausible explanation that can be checked is more credible than one without.
- Replicate. Check whether the pattern appears in another period, market or dataset.
- Report the search. Say how many relationships were examined, not only those that were found.
Key takeaways
People naturally see patterns in randomness, and pressure to explain uncertain results can strengthen this tendency. Large datasets make chance patterns more common, because the number of possible relationships grows faster than the data, and the flexibility of analysis adds further false findings. Real insights survive pre-stated questions, corrections for multiple comparisons, tests on held-back data and replication. Patterns that appear only after an extensive search, without a mechanism and without confirmation, should be treated as hypotheses rather than knowledge.
References
Anderson, C. (2008, June 23). The end of theory: The data deluge makes the scientific method obsolete. Wired.
Benjamini, Y., & Hochberg, Y. (1995). Controlling the false discovery rate: A practical and powerful approach to multiple testing. Journal of the Royal Statistical Society: Series B (Methodological), 57(1), 289–300. https://doi.org/10.1111/j.2517-6161.1995.tb02031.x
Bennett, C. M., Baird, A. A., Miller, M. B., & Wolford, G. L. (2010). Neural correlates of interspecies perspective taking in the post-mortem Atlantic salmon: An argument for proper multiple comparisons correction. Journal of Serendipitous and Unexpected Results, 1(1), 1–5.
boyd, d., & Crawford, K. (2012). Critical questions for big data: Provocations for a cultural, technological, and scholarly phenomenon. Information, Communication & Society, 15(5), 662–679. https://doi.org/10.1080/1369118X.2012.678878
Calude, C. S., & Longo, G. (2017). The deluge of spurious correlations in big data. Foundations of Science, 22(3), 595–612. https://doi.org/10.1007/s10699-016-9489-4
Conrad, K. (1958). Die beginnende Schizophrenie: Versuch einer Gestaltanalyse des Wahns. Thieme.
Foster, K. R., & Kokko, H. (2009). The evolution of superstitious and superstition-like behaviour. Proceedings of the Royal Society B: Biological Sciences, 276(1654), 31–37. https://doi.org/10.1098/rspb.2008.0981
Gelman, A., & Loken, E. (2014). The statistical crisis in science. American Scientist, 102(6), 460–465. https://doi.org/10.1511/2014.111.460
Gilovich, T., Vallone, R., & Tversky, A. (1985). The hot hand in basketball: On the misperception of random sequences. Cognitive Psychology, 17(3), 295–314. https://doi.org/10.1016/0010-0285(85)90010-6
Ioannidis, J. P. A. (2005). Why most published research findings are false. PLoS Medicine, 2(8), Article e124. https://doi.org/10.1371/journal.pmed.0020124
Lazer, D., Kennedy, R., King, G., & Vespignani, A. (2014). The parable of Google Flu: Traps in big data analysis. Science, 343(6176), 1203–1205. https://doi.org/10.1126/science.1248506
Shermer, M. (2008). Patternicity: Finding meaningful patterns in meaningless noise. Scientific American, 299(6), 48. https://doi.org/10.1038/scientificamerican1208-48
Simmons, J. P., Nelson, L. D., & Simonsohn, U. (2011). False-positive psychology: Undisclosed flexibility in data collection and analysis allows presenting anything as significant. Psychological Science, 22(11), 1359–1366. https://doi.org/10.1177/0956797611417632
Vigen, T. (2015). Spurious correlations. Hachette Books.
Whitson, J. A., & Galinsky, A. D. (2008). Lacking control increases illusory pattern perception. Science, 322(5898), 115–117. https://doi.org/10.1126/science.1159845