
Insights · Tools and the future
Multi-Sensory and Immersive Analytics for Enhanced Insight Formation
What immersive analytics, virtual and augmented reality, sonification, haptics and physical data models offer for understanding data, what research shows about when they help and when flat charts remain better, and how insight teams can evaluate them.
Most insight is still communicated through flat charts on screens and paper. New technologies offer other options. Virtual and augmented reality headsets can place people inside three-dimensional data. Sound can represent changes in data over time. Touch and physical models can make data tangible. Together these approaches are known as immersive or multi-sensory analytics. Their promise is that engaging more of the senses, and more of the space around us, will help people understand complex data and reach insights they would otherwise miss. The research so far suggests a more qualified picture: these methods help with some tasks and some audiences, and are worse than simple charts for others. This article reviews what is known.
What immersive analytics is
Chandler et al. (2015) described immersive analytics as the use of engaging, embodied analysis tools to support data understanding and decision making, drawing on technologies such as large displays, virtual and augmented reality, and touch and gesture interfaces. Marriott et al. (2018) brought together research on the field and identified its main promise: allowing people to use their bodies, space and multiple senses to explore data, and allowing groups to work with data together in shared spaces.
Slater and Wilbur (1997) distinguished immersion, an objective property of a technology, such as how much of the senses it engages and how vivid its display is, from presence, the subjective sense of being in a place. Immersive analytics aims to use both to make data easier to explore and understand.
Why more senses might help
Theories of learning offer some support. Paivio (1986) proposed dual coding theory, in which information represented both verbally and visually is remembered better than information represented in one form. Mayer (2009) found that people learn better from words and pictures than from words alone, and that presenting words as speech rather than text alongside pictures can reduce overload, because it spreads the load across visual and auditory channels. Sweller (1988) emphasised that working memory has limited capacity, so presentations that make better use of it can improve understanding.
These findings suggest that combining senses can help, but only if each adds information rather than distraction. A chart accompanied by a spoken explanation is a simple, well-supported example. A display that adds sound effects, animation and 3D depth without adding information is likely to increase load rather than reduce it.
Three dimensions: help and hindrance
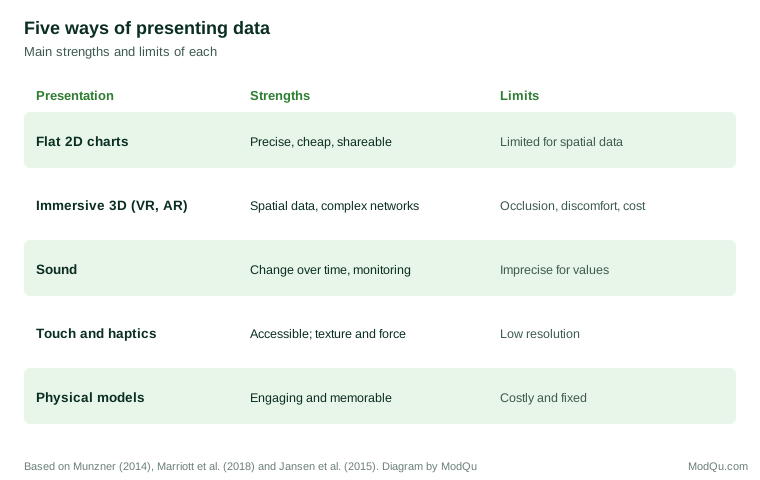
Three-dimensional displays are the most visible feature of immersive analytics, and the most contested. Munzner (2014) argued that 3D representations of abstract data are usually harmful, because objects hide each other, perspective distorts sizes and positions, and the viewer must move to see everything. Cleveland and McGill (1984) found that volume is one of the least accurately judged visual encodings.
There are exceptions. Ware and Franck (1996) found that stereoscopic viewing combined with motion greatly improved people's ability to trace paths in complex network diagrams, allowing much larger networks to be understood than in 2D. Data that are inherently spatial, such as the layout of a store, a building or a city, can also benefit from 3D presentation, because the representation matches the thing represented.
But for abstract data, evidence often favours 2D. Cockburn and McKenzie (2002) compared people's ability to find and remember items in two- and three-dimensional interfaces and found that performance was generally better in 2D, and that participants found the 3D versions harder to use. Kraus et al. (2022) surveyed research on immersive 3D visualisations of abstract data and concluded that their benefits depend heavily on the task, and that many studies showed no advantage, or a disadvantage, compared with 2D.
Immersion has costs of its own. LaViola (2000) reviewed "cybersickness", nausea and discomfort caused by virtual environments, which affects a significant share of users. Headsets also isolate users from colleagues and from other information, unless systems are designed for shared use.
Interaction through the body
One promising direction is using the body to interact with data. Cordeil et al. (2017) developed a system in which users in virtual reality could grab, move and combine data axes with their hands to build scatter plots and other views, and found that users could explore multivariate data in this way with little training. Isenberg et al. (2013) described research on visualisation on large interactive surfaces, such as touch tables and walls, which allow groups to explore data together. For collaborative sense-making, such as workshops, these may offer more than individual headsets. Augmented reality, which overlays data on the physical world rather than replacing it, offers a middle path: a store manager could see sales figures displayed on the shelves themselves, or a group could gather around a shared 3D model while still seeing each other. Such uses are still mostly experimental, and their value for routine insight work has yet to be demonstrated in controlled comparisons.
Sound
Sonification represents data as sound. Hermann et al. (2011) brought together research on the field, and Walker and Nees (2011) set out its theory: properties of sound such as pitch, loudness, tempo and timbre can represent data values, and people are particularly good at hearing changes, rhythms and patterns over time. Sound can be monitored while attention is elsewhere, which makes it useful for alerting, and it makes data accessible to people with visual impairments. But people judge pitch and loudness less precisely than visual position, and multiple sound streams quickly become confusing.
Touch and physical models
Haptic interfaces represent data through touch, for example through force or vibration. Paneels and Roberts (2010) reviewed designs for haptic data visualisation and noted their value for people with visual impairments and for conveying properties such as texture and resistance, but also the limited resolution of touch compared with vision.
Physical models of data, such as 3D-printed charts, are another option. Jansen et al. (2013) compared physical 3D bar charts with the same charts shown on screen and found that people retrieved information more efficiently from the physical versions, partly because they could touch and turn them. Jansen et al. (2015) reviewed the opportunities of "data physicalisation", including engaging audiences, supporting memory and making data accessible, alongside the cost and inflexibility of physical models.
Accessibility
Accessibility is one of the strongest arguments for multi-sensory analytics, and one of the least discussed in business settings. Insight that exists only as charts excludes colleagues and customers who are blind or have low vision. Sonified charts, tactile graphics, physical models and well-written text descriptions can make the same findings available to them. A chart's alternative text, describing what the chart shows and its main point, is the simplest form of multi-sensory presentation and benefits every reader who uses a screen reader. Designing insight outputs with more than one route to understanding is good practice whatever technology is used.
Novelty is not insight
New technologies attract attention, and attention can be mistaken for understanding. Participants in a first immersive session often report that it was engaging and that they learned a great deal, whether or not their understanding of the data actually improved. Evaluations that rely on users' impressions, rather than on measures of what they can correctly answer or decide after using the tool, are likely to overstate its value. The novelty also fades: a format that impresses in its first use may become tiresome by its tenth. The fair test is whether people answer questions about the data more accurately or make better decisions, compared with a well-designed conventional presentation.
An example
Consider a hypothetical supermarket chain studying how shoppers move through its stores. Its insight team has location data from shopping trolleys and wants to show managers where congestion occurs and which aisles are rarely visited.
The team builds two presentations. The first is a set of 2D floor plans with heat maps of traffic and a bar chart of visits by aisle. The second is a virtual reality walk-through in which managers move through a model of the store with traffic shown as coloured paths at floor level.
In a small comparison, managers using the walk-through were better at identifying where congestion would block sightlines to promotional displays, because they could see the store from a shopper's eye level. Managers using the floor plans and bar chart were faster and more accurate at ranking aisles by traffic and comparing stores. Several managers using the headset reported mild discomfort after about ten minutes.
The team kept both. The walk-through was used in layout workshops, where seeing the space mattered; the 2D charts were used for routine reporting and comparison across stores. The choice of format followed the task, not the technology.
When immersive and multi-sensory methods help
The evidence suggests these methods are most useful when:
- The data are spatial. Store layouts, building flows, city movements and physical products map naturally onto space.
- The structure is very complex. Large networks may benefit from stereoscopic 3D and motion.
- The aim is engagement or memory. Physical models and immersive experiences can make findings memorable for audiences who will see them once.
- Accessibility matters. Sound and touch can make data available to people who cannot use visual charts.
- Groups work together. Large shared surfaces can support collaborative exploration.
They are least useful for the core task of most insight work: comparing values precisely, where well-designed 2D charts remain superior.
Evaluating new tools
Before adopting immersive or multi-sensory tools, insight teams can ask:
- What task will the tool support, and is there evidence that it helps with that task?
- Has it been compared with a well-designed 2D alternative?
- Does the novelty of the experience risk being mistaken for insight?
- What does it cost in equipment, training, time and comfort?
- Can findings be shared with people who were not in the headset or the room?
Running a small comparison, in which some users work with the new tool and others with conventional charts on the same questions, is a practical way to judge whether the tool improves understanding or merely impresses.
Key takeaways
Immersive and multi-sensory analytics use 3D space, sound, touch and physical models to present data. Learning research suggests combining senses can help, but only when each adds information. Three-dimensional displays help with spatial data and some complex networks, but often hinder precise comparison of abstract data and can cause discomfort. Sound suits monitoring and changes over time; touch and physical models aid accessibility, engagement and memory. For most insight tasks, well-designed 2D charts remain best, and new tools should be adopted where evidence shows they help with a specific task.
References
Chandler, T., Cordeil, M., Czauderna, T., Dwyer, T., Glowacki, J., Goncu, C., Klapperstueck, M., Klein, K., Marriott, K., Schreiber, F., & Wilson, E. (2015). Immersive analytics. In 2015 Big Data Visual Analytics (BDVA) (pp. 1–8). IEEE. https://doi.org/10.1109/BDVA.2015.7314296
Cleveland, W. S., & McGill, R. (1984). Graphical perception: Theory, experimentation, and application to the development of graphical methods. Journal of the American Statistical Association, 79(387), 531–554. https://doi.org/10.1080/01621459.1984.10478080
Cockburn, A., & McKenzie, B. (2002). Evaluating the effectiveness of spatial memory in 2D and 3D physical and virtual environments. In Proceedings of the SIGCHI Conference on Human Factors in Computing Systems (pp. 203–210). ACM. https://doi.org/10.1145/503376.503413
Cordeil, M., Cunningham, A., Dwyer, T., Thomas, B. H., & Marriott, K. (2017). ImAxes: Immersive axes as embodied affordances for interactive multivariate data visualisation. In Proceedings of the 30th Annual ACM Symposium on User Interface Software and Technology (pp. 71–83). ACM. https://doi.org/10.1145/3126594.3126613
Hermann, T., Hunt, A., & Neuhoff, J. G. (Eds.). (2011). The sonification handbook. Logos.
Isenberg, P., Isenberg, T., Hesselmann, T., Lee, B., von Zadow, U., & Tang, A. (2013). Data visualization on interactive surfaces: A research agenda. IEEE Computer Graphics and Applications, 33(2), 16–24. https://doi.org/10.1109/MCG.2013.24
Jansen, Y., Dragicevic, P., & Fekete, J.-D. (2013). Evaluating the efficiency of physical visualizations. In Proceedings of the SIGCHI Conference on Human Factors in Computing Systems (pp. 2593–2602). ACM. https://doi.org/10.1145/2470654.2481359
Jansen, Y., Dragicevic, P., Isenberg, P., Alexander, J., Karnik, A., Kildal, J., Subramanian, S., & Hornbæk, K. (2015). Opportunities and challenges for data physicalization. In Proceedings of the 33rd Annual ACM Conference on Human Factors in Computing Systems (pp. 3227–3236). ACM. https://doi.org/10.1145/2702123.2702180
Kraus, M., Fuchs, J., Sommer, B., Klein, K., Engelke, U., Keim, D., & Schreiber, F. (2022). Immersive analytics with abstract 3D visualizations: A survey. Computer Graphics Forum, 41(1), 201–229. https://doi.org/10.1111/cgf.14430
LaViola, J. J., Jr. (2000). A discussion of cybersickness in virtual environments. ACM SIGCHI Bulletin, 32(1), 47–56. https://doi.org/10.1145/333329.333344
Marriott, K., Schreiber, F., Dwyer, T., Klein, K., Henry Riche, N., Itoh, T., Stuerzlinger, W., & Thomas, B. H. (Eds.). (2018). Immersive analytics. Springer. https://doi.org/10.1007/978-3-030-01388-2
Mayer, R. E. (2009). Multimedia learning (2nd ed.). Cambridge University Press. https://doi.org/10.1017/CBO9780511811678
Munzner, T. (2014). Visualization analysis and design. CRC Press. https://doi.org/10.1201/b17511
Paivio, A. (1986). Mental representations: A dual coding approach. Oxford University Press.
Paneels, S., & Roberts, J. C. (2010). Review of designs for haptic data visualization. IEEE Transactions on Haptics, 3(2), 119–137. https://doi.org/10.1109/TOH.2009.44
Slater, M., & Wilbur, S. (1997). A framework for immersive virtual environments (FIVE): Speculations on the role of presence in virtual environments. Presence: Teleoperators and Virtual Environments, 6(6), 603–616. https://doi.org/10.1162/pres.1997.6.6.603
Sweller, J. (1988). Cognitive load during problem solving: Effects on learning. Cognitive Science, 12(2), 257–285. https://doi.org/10.1207/s15516709cog1202_4
Walker, B. N., & Nees, M. A. (2011). Theory of sonification. In T. Hermann, A. Hunt, & J. G. Neuhoff (Eds.), The sonification handbook (pp. 9–39). Logos.
Ware, C., & Franck, G. (1996). Evaluating stereo and motion cues for visualizing information nets in three dimensions. ACM Transactions on Graphics, 15(2), 121–140. https://doi.org/10.1145/234972.234975