
Insights · Generating insight
Insights in Complex Systems: Emergence, Feedback, and Knowledge Dynamics
How ideas from systems thinking and complexity science help analysts generate insight about markets and organisations, covering feedback loops, delays, emergence, nonlinearity and unpredictability, and the practical limits they place on analysis.
Many of the questions insight teams are asked concern systems rather than isolated events. Why do sales rise and fall in cycles? Why did a small price change trigger a large shift in market share? Why did a successful product suddenly stop growing? Answers based on a single cause often fail, because in markets and organisations causes interact, effects feed back on their causes and outcomes emerge from the behaviour of many independent actors. Systems thinking and complexity science offer concepts that help analysts recognise such situations and generate better insight about them.
Systems, feedback and delays
A system is a set of parts connected so that they produce a pattern of behaviour over time. Forrester (1961) developed system dynamics to study how the structure of an industrial firm, its flows of orders, inventory, labour and information, produced fluctuations in production and employment. Forrester showed that many problems blamed on outside events were generated by the firm's own policies.
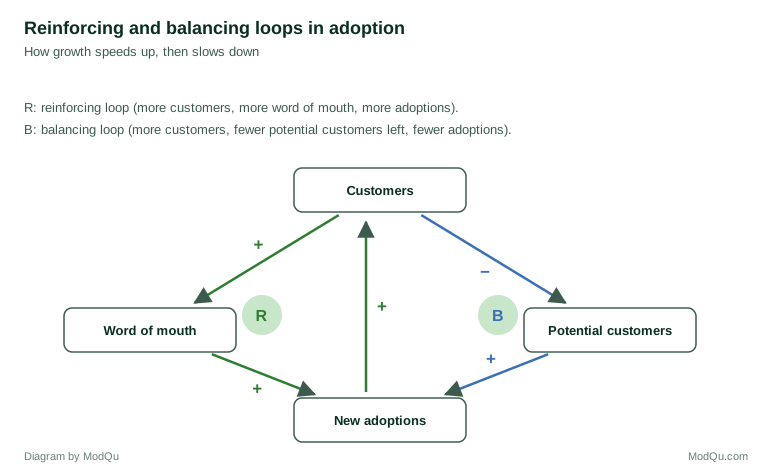
The central concept is feedback. In a reinforcing loop, a change produces more change in the same direction: more customers lead to more word of mouth, which leads to more customers. In a balancing loop, a change produces a counteracting response: as a market approaches saturation, there are fewer potential new customers, and growth slows. Meadows (2008) explained how the behaviour of most systems can be understood as the interaction of a few reinforcing and balancing loops.
Delays add to the difficulty. When there is a long gap between an action and its effect, people tend to over-correct. Sterman (1989) studied this in an experiment in which participants managed a simulated supply chain. Most participants created large, costly swings in inventory because they ignored orders they had already placed but not yet received. Sterman concluded that people systematically misperceive feedback, especially when delays are involved. Lee et al. (1997) described the same pattern in real supply chains, where small changes in consumer demand become larger fluctuations in orders further up the chain, an effect known as the bullwhip effect.
Emergence
In complex systems, patterns at the level of the whole can arise from the interactions of many parts, without being designed or intended by any of them. This is called emergence. Anderson (1972) argued that each level of organisation in nature has its own properties that cannot be predicted simply from knowledge of the level below. Holland (1995) described complex adaptive systems, in which many agents follow simple rules and adapt to each other, producing behaviour that is coherent at the level of the whole but hard to predict from the rules alone.
Markets are complex adaptive systems. Prices, trends and brand reputations emerge from the decisions of many customers, competitors and intermediaries responding to each other. Granovetter (1978) showed how collective behaviour can depend on the distribution of individual thresholds, the number of others who must act before a given person will act. Two groups with almost identical average attitudes can behave very differently if their thresholds are distributed differently. A small change in a few individuals can tip a whole group, or fail to.
Unpredictability
A consequence of emergence and feedback is that some outcomes are inherently unpredictable. Salganik et al. (2006) created an online music market in which participants could listen to and download songs. In some versions, participants could see how many times each song had been downloaded by others; in others they could not. When participants could see others' choices, success became more unequal and less predictable. The same songs ended up with very different levels of success in different, independent versions of the market. Quality mattered, but social influence amplified small early differences into large ones.
For insight teams, this research is a caution against explaining success after the fact. When a product succeeds, it is tempting to identify the features that "caused" its success. In systems with strong social influence, much of the outcome may have been determined by early chance events. Analysts should ask how much of an outcome could have been predicted at the time and avoid overconfident lessons from single cases.
Kurtz and Snowden (2003) proposed the Cynefin framework, which distinguishes between situations that are simple or complicated, where cause and effect can be determined by analysis, and situations that are complex, where cause and effect can be seen only in retrospect. In complex situations, they recommended probing with small experiments, sensing the response and amplifying what works, rather than relying on detailed upfront analysis.
Diffusion as an example
The spread of a new product combines reinforcing and balancing loops. Bass (1969) modelled adoption as the result of two forces: innovation, in which people adopt independently of others, and imitation, in which they adopt because others have. Early in a product's life, adoption is slow, because few people have adopted and imitation is weak. As adopters accumulate, imitation accelerates adoption. Later, as the pool of potential adopters is used up, adoption slows. The result is the familiar S-shaped curve of cumulative adoption.
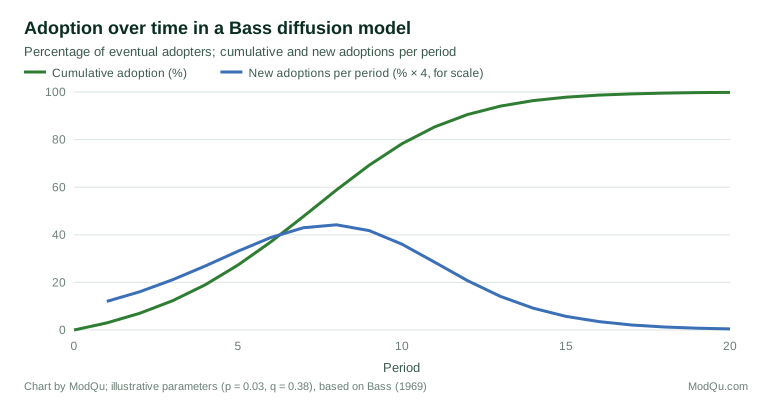
The model offers an insight that is easy to miss when looking only at recent sales. A sharp slowdown in new adoptions does not necessarily mean the product has lost appeal. It may simply reflect the balancing loop: most of the people who will ever adopt it already have.
The limits of measurement in systems
Measuring a system can change it. Campbell (1979) argued that the more a quantitative indicator is used for social decision making, the more it will be subject to corruption pressures and the more it will distort the processes it is meant to monitor. When a measure becomes a target, people adapt their behaviour to the measure rather than to the underlying goal. Insight teams that set up dashboards and performance indicators should expect the system to respond to them.
Repenning and Sterman (2001) studied improvement programmes in manufacturing and product development and found a common trap. Under pressure to meet targets, managers pushed people to work harder rather than invest time in improving processes. This produced short-term gains but eroded capability, leading to more pressure and further erosion. The problem was not a lack of effort but a structure of feedback that rewarded short-term fixes.
Recurring patterns
Some system structures appear so often that they have been given names. Senge (1990) described several such "archetypes". In "fixes that fail", a quick solution relieves a problem in the short term but has side effects that make the problem worse later, as when heavy discounting lifts this quarter's sales but trains customers to wait for the next discount. In "shifting the burden", a symptomatic solution is used so often that the organisation loses the ability to address the underlying cause. In "limits to growth", a reinforcing loop drives growth until a balancing loop, such as market saturation or capacity limits, slows it. Recognising an archetype helps analysts ask the right questions: what side effects might this fix have, and what limit is this growth approaching?
Dörner (1996) studied how people managed simulated complex systems, such as a small town or a developing region. Participants who performed poorly tended to act without forming clear goals, focused on one problem at a time, ignored side effects and long-term consequences, and failed to check the results of their actions. Participants who performed well asked more questions, considered how variables were connected and adjusted their actions in response to what they observed.
Perrow (1984) argued that in systems whose parts are tightly coupled and interact in complex ways, accidents are to be expected, because small failures can combine in ways that nobody anticipated. The same logic applies to supply chains and digital platforms, where a minor change in one part can spread quickly.
Models in changing systems
Systems also change over time, which affects analytical models built on past data. Lazer et al. (2014) described how a model that estimated influenza levels from internet search data initially tracked official figures closely but later overestimated them substantially. Part of the problem was that the search engine itself kept changing, altering the behaviour the model depended on. A model of a system that adapts must be monitored and recalibrated, because the relationships it relies on may not last.
An example
A subscription software company saw its growth slow sharply after three years of rapid expansion. The first explanation offered was that a competitor's new product was taking customers. An analyst who drew a simple loop diagram noticed two other possibilities. The company's referral programme had driven much of its early growth, but most potential customers in its core market had already signed up. At the same time, the support team, which had not grown with the customer base, was taking longer to resolve problems, and dissatisfied customers were recommending the product less. Data confirmed both effects. The competitor explanation would have led to price cuts; the systems view led to investment in support and expansion into adjacent markets.
Practical lessons for insight work
Several lessons follow. First, look for loops, not just causes. When a trend accelerates or reverses, ask what feedback might be driving it. Second, account for delays. The effects of a decision may not appear for months, and judging it too early can lead to over-correction. Third, distinguish between outcomes that could have been predicted and those that depended on chance and social influence. Fourth, in complex situations, prefer small experiments and close monitoring to large, confident plans. Fifth, remember that measures influence behaviour.
Simple tools help. Causal loop diagrams make assumptions about feedback explicit and open to discussion. Sterman (2000) described how simulation models can be used to test how a system might respond to different policies before they are introduced. Even an informal sketch of the main loops can reveal why a policy that seems obviously right may produce the opposite of what was intended.
Conclusion
Markets and organisations are systems in which feedback, delays and the interaction of many actors produce patterns that no one designs. Insight about such systems requires looking beyond single causes to the structures that generate behaviour over time (Forrester, 1961; Meadows, 2008), recognising that some outcomes are inherently unpredictable (Salganik et al., 2006) and using experiments and monitoring rather than relying only on prediction (Kurtz & Snowden, 2003). Analysts who think in terms of systems are better able to explain what is happening and less likely to recommend actions that the system will defeat.
References
Anderson, P. W. (1972). More is different. Science, 177(4047), 393–396. https://doi.org/10.1126/science.177.4047.393
Bass, F. M. (1969). A new product growth for model consumer durables. Management Science, 15(5), 215–227. https://doi.org/10.1287/mnsc.15.5.215
Campbell, D. T. (1979). Assessing the impact of planned social change. Evaluation and Program Planning, 2(1), 67–90. https://doi.org/10.1016/0149-7189(79)90048-X
Dörner, D. (1996). The logic of failure: Recognizing and avoiding error in complex situations. Metropolitan Books.
Forrester, J. W. (1961). Industrial dynamics. MIT Press.
Granovetter, M. (1978). Threshold models of collective behavior. American Journal of Sociology, 83(6), 1420–1443. https://doi.org/10.1086/226707
Holland, J. H. (1995). Hidden order: How adaptation builds complexity. Addison-Wesley.
Kurtz, C. F., & Snowden, D. J. (2003). The new dynamics of strategy: Sense-making in a complex and complicated world. IBM Systems Journal, 42(3), 462–483. https://doi.org/10.1147/sj.423.0462
Lazer, D., Kennedy, R., King, G., & Vespignani, A. (2014). The parable of Google Flu: Traps in big data analysis. Science, 343(6176), 1203–1205. https://doi.org/10.1126/science.1248506
Lee, H. L., Padmanabhan, V., & Whang, S. (1997). Information distortion in a supply chain: The bullwhip effect. Management Science, 43(4), 546–558. https://doi.org/10.1287/mnsc.43.4.546
Meadows, D. H. (2008). Thinking in systems: A primer. Chelsea Green.
Perrow, C. (1984). Normal accidents: Living with high-risk technologies. Basic Books.
Repenning, N. P., & Sterman, J. D. (2001). Nobody ever gets credit for fixing problems that never happened: Creating and sustaining process improvement. California Management Review, 43(4), 64–88. https://doi.org/10.2307/41166101
Salganik, M. J., Dodds, P. S., & Watts, D. J. (2006). Experimental study of inequality and unpredictability in an artificial cultural market. Science, 311(5762), 854–856. https://doi.org/10.1126/science.1121066
Senge, P. M. (1990). The fifth discipline: The art and practice of the learning organization. Doubleday.
Sterman, J. D. (1989). Modeling managerial behavior: Misperceptions of feedback in a dynamic decision making experiment. Management Science, 35(3), 321–339. https://doi.org/10.1287/mnsc.35.3.321
Sterman, J. D. (2000). Business dynamics: Systems thinking and modeling for a complex world. Irwin/McGraw-Hill.