
The Generation of Knowledge · Trust, quality and the future
Knowledge Graphs and Machine-Readable Knowledge
What knowledge graphs are, how they grew from semantic networks and the semantic web, how ontologies, linked data and open projects such as Wikidata work, what knowledge graphs offer and where they fall short, and how they can make survey and statistical knowledge easier to find, combine and reuse.
Most human knowledge is written for people to read. A report, an article or a table makes sense to a reader who understands its language and context, but a computer sees only strings of characters. If a report says that a survey measured household income in Canada in 2024, a person grasps at once what was measured, where and when. A computer does not, unless the information is expressed in a form it can interpret. Machine-readable knowledge is knowledge expressed in such a form, so that computers can find it, connect it to other knowledge and reason with it. The most widely used form today is the knowledge graph. This article explains what knowledge graphs are, where they came from, what they make possible and what limits them.
What a knowledge graph is
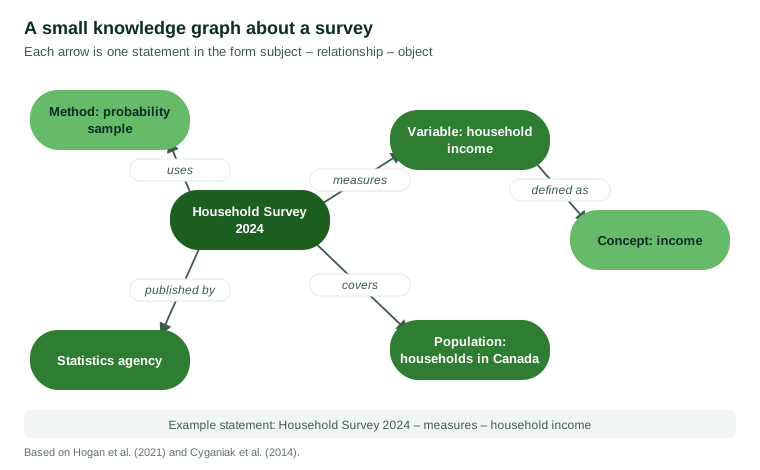
A knowledge graph represents knowledge as a network of entities and the relationships between them. Each piece of knowledge is a simple statement made up of three parts: a subject, a relationship and an object. "Ottawa – is the capital of – Canada" is one such statement. "Household Survey 2024 – measures – household income" is another. Statements of this kind are often called triples. When many triples share entities, they form a graph: a web of nodes connected by labelled links.
Hogan et al. (2021), in a comprehensive review, defined a knowledge graph as a graph of data intended to accumulate and convey knowledge of the real world, whose nodes represent entities of interest and whose edges represent relations between them. Ehrlinger and Wöß (2016) noted that the term was used loosely in the literature and argued that a knowledge graph should be understood as more than a database: it combines data with a formal description of the concepts used, so that new knowledge can be derived by reasoning.
Origins
Semantic networks and expert systems
The idea of representing knowledge as a network is older than the term knowledge graph. Quillian (1967) proposed a model of human memory in which word concepts were stored as nodes linked by relationships, so that the meaning of a word could be found by following its links to other concepts. Such semantic networks became a central technique in artificial intelligence. Brachman and Levesque (2004) described how researchers developed formal languages for representing knowledge so that computers could draw reliable conclusions from it.
One of the most ambitious efforts was Cyc, begun in 1984. Lenat (1995) described its aim of encoding millions of pieces of everyday common-sense knowledge, such as the fact that objects fall when dropped, so that computer programs could reason as people do. Cyc showed both the power and the cost of building knowledge by hand: progress required decades of work by trained specialists.
Ontologies
A knowledge graph depends on agreement about the concepts it uses. Gruber (1993) defined an ontology, in this sense, as an explicit specification of a conceptualisation: a formal description of the kinds of things that exist in a domain, their properties and the relationships between them. An ontology for surveys might state that every survey has a population, a sampling method and a set of variables, and that every variable measures a concept. Ontologies allow different systems to share knowledge without misunderstanding, because they agree on what terms mean.
The semantic web and linked data
Berners-Lee et al. (2001) proposed a semantic web, an extension of the World Wide Web in which information would be given well-defined meaning so that computers and people could work together. Instead of pages written only for human readers, the web would also contain data that software could interpret. The World Wide Web Consortium developed standards to make this possible, including the Resource Description Framework (RDF), a model for expressing knowledge as triples in which each entity and relationship is identified by a web address (Cyganiak et al., 2014).
Shadbolt et al. (2006) reviewed the first years of the semantic web and acknowledged that the full vision had been slow to arrive. They argued that progress would come from sharing data, using simple shared vocabularies, rather than from building elaborate ontologies first. Bizer et al. (2009) described the linked data movement that followed. Its principles were simple: give things web addresses, make those addresses provide useful information in standard formats, and include links to other things so that more can be discovered. By 2009, linked data had produced a large web of interconnected datasets, covering subjects from geography to music to scientific publications. Heath and Bizer (2011) described how this approach turned the web into a global data space.
Knowledge graphs at scale
Open knowledge graphs
Two open projects showed that knowledge graphs could be built on a very large scale. Auer et al. (2007) described DBpedia, which extracted structured information from Wikipedia, such as the facts in the information boxes that appear beside many articles, and published it as linked data. Vrandečić and Krötzsch (2014) described Wikidata, launched in 2012 by the Wikimedia Foundation as a free knowledge base that anyone can edit. Unlike DBpedia, which extracted facts from text, Wikidata was designed from the start as structured data. Each statement can carry references to its sources and qualifiers that specify, for example, the date from which a fact held. Wikidata now contains statements about many millions of items and is used to supply facts to Wikipedia in many languages.
Industry knowledge graphs
In 2012, Google introduced its Knowledge Graph to improve its search results. Singhal (2012) explained that the aim was to search for "things, not strings": to understand that a query referred to a particular person, place or thing and to return facts about it, rather than only pages containing the words typed. At launch, the graph contained more than 500 million objects and more than 3.5 billion facts about them and their relationships. Noy et al. (2019) described the knowledge graphs built by several large technology companies and the challenges they shared: keeping knowledge current as the world changes, resolving which records refer to the same entity, handling contradictory sources, and representing uncertainty and change over time.
Guha et al. (2016) described Schema.org, a shared vocabulary launched by major search engines in 2011 that allows website owners to mark up information on their pages, such as events, products, organisations and datasets, in a machine-readable way. Its wide adoption made structured data a routine part of the web.
What knowledge graphs offer
Knowledge graphs offer several advantages over knowledge stored only in text or in separate databases.
Integration. Because entities are identified uniquely, knowledge from different sources can be combined. A survey dataset, a census table and a news report can all refer to the same city, and a knowledge graph can bring their information together.
Discovery. Links allow users and software to move from one piece of knowledge to related pieces, finding connections that would otherwise be hard to see.
Reasoning. With an ontology, a system can derive facts that were not stated explicitly. If a graph states that every household survey covers households and that a particular study is a household survey, the system can infer what the study covers.
Provenance. Statements can carry information about their sources, dates and reliability, so that users can judge how far to trust them.
Reuse. The FAIR principles for scientific data management call for data to be findable, accessible, interoperable and reusable, by both people and machines (Wilkinson et al., 2016). Knowledge graphs and linked data are among the main technologies used to meet these principles, because they describe data in a standard, machine-readable way.
Limits and problems
Knowledge graphs also have significant weaknesses. Paulheim (2017) reviewed methods for refining knowledge graphs and noted that no graph is complete or fully correct. Large graphs built automatically from text contain errors introduced during extraction. Graphs built by communities reflect the interests of their contributors, so that some topics and regions are covered in far more detail than others. Many facts are missing simply because no one has added them.
Knowledge graphs also struggle with the kinds of knowledge that do not fit neatly into triples: uncertain estimates, contested claims, knowledge that depends on context, and change over time. A statement such as "public trust in science is falling" is a claim about a trend, based on particular surveys, with margins of error and competing interpretations. Reducing it to a single triple would strip away the context that gives it meaning. Representing such knowledge faithfully requires additional structure, such as qualifiers, references and dates, which adds complexity.
Finally, building and maintaining a good knowledge graph is costly. As the history of Cyc showed, careful knowledge engineering requires sustained expert effort, and as Noy et al. (2019) found, even large organisations struggle to keep graphs accurate as the world changes.
Building a knowledge graph in practice
Organisations that build knowledge graphs usually follow a similar sequence. They begin by deciding which questions the graph should answer, since a graph built without a purpose tends to grow large and unused. They then define the main kinds of entity and relationship they need, reusing existing vocabularies such as Schema.org or established domain ontologies wherever possible rather than inventing their own. Next, they map their existing data to these definitions and link their entities to identifiers used elsewhere, such as Wikidata items or official codes for places and industries, so that their graph can connect to others. Finally, they set up processes to keep the graph current, to check new statements and to record where each statement came from.
The most difficult step is often entity resolution: deciding when two records refer to the same thing. A company may appear under several names, a person may share a name with others, and a place may have changed its boundaries. Errors in entity resolution spread through every inference the graph supports, so it deserves careful checking (Noy et al., 2019).
Knowledge graphs and artificial intelligence
The rise of large language models has given knowledge graphs a new role. Language models generate fluent text but can produce false statements, because they predict likely words rather than looking up facts. Knowledge graphs store explicit, checkable facts but cannot generate natural language or handle open-ended questions. Pan et al. (2024) proposed a roadmap for combining the two: knowledge graphs can supply language models with reliable facts and allow their outputs to be checked, while language models can help to build and query knowledge graphs. Lewis et al. (2020) showed that language models perform better on questions that require factual knowledge when they retrieve relevant documents from an external source before generating an answer, an approach known as retrieval-augmented generation. Structured knowledge sources such as knowledge graphs are one way of providing such grounding.
Machine-readable knowledge in survey and statistical research
Survey and statistical organisations produce exactly the kind of knowledge that benefits from being machine-readable. Their findings concern defined populations, measured with specific questions, at particular times, using documented methods. When this information is captured only in a report, it is hard to find and combine. When it is described in standard machine-readable form, it can be searched, compared and reused.
Several standards support this. The Data Documentation Initiative (DDI) provides a detailed standard for describing social science surveys and their variables, questions, samples and methods (Vardigan et al., 2008). The RDF Data Cube vocabulary, a recommendation of the World Wide Web Consortium, allows statistical tables to be published as linked data, so that each figure is connected to the dimensions, such as region, year and population group, that define it (Cyganiak & Reynolds, 2014). Schema.org includes a vocabulary for describing datasets so that search engines can find them (Guha et al., 2016).
For a research organisation, adopting these practices has several benefits. Clients and researchers can find relevant studies more easily. Results from different studies can be compared because they use shared definitions of concepts and populations. Provenance is preserved, because each figure remains linked to the survey, question and method that produced it. And the organisation's own archive becomes a source of knowledge that can be queried and reused, rather than a collection of documents that must be read one by one.
Machine-readable knowledge also raises questions of governance. Once survey results are published in a form that software can combine with other data, they may be used in ways their producers did not foresee. Aggregated results that are safe on their own could, in principle, be linked with other sources to reveal information about small groups. Producers should therefore apply the same confidentiality rules to machine-readable outputs as to printed tables, and should describe clearly the limits of their data, such as the population covered and the margin of error, so that these limits travel with the figures wherever they are reused.
Conclusion
Knowledge graphs represent knowledge as networks of entities and relationships that computers can interpret. They grew from early work on semantic networks and ontologies, through the vision of the semantic web and the linked data movement, to large open projects such as Wikidata and the industrial graphs that support search engines. They make it possible to integrate knowledge from many sources, discover connections, reason with explicit facts and record where knowledge came from. They are also incomplete, uneven and costly to maintain, and they struggle to represent uncertainty and context. For producers of survey and statistical knowledge, machine-readable description of studies, variables and results offers a practical way to make knowledge easier to find, compare and trust, and to ensure that it remains useful to both people and machines.
References
Auer, S., Bizer, C., Kobilarov, G., Lehmann, J., Cyganiak, R., & Ives, Z. (2007). DBpedia: A nucleus for a web of open data. In K. Aberer et al. (Eds.), The semantic web: ISWC 2007 + ASWC 2007 (Lecture Notes in Computer Science, Vol. 4825, pp. 722–735). Springer. https://doi.org/10.1007/978-3-540-76298-0_52
Berners-Lee, T., Hendler, J., & Lassila, O. (2001). The semantic web. Scientific American, 284(5), 34–43. https://doi.org/10.1038/scientificamerican0501-34
Bizer, C., Heath, T., & Berners-Lee, T. (2009). Linked data: The story so far. International Journal on Semantic Web and Information Systems, 5(3), 1–22. https://doi.org/10.4018/jswis.2009081901
Brachman, R. J., & Levesque, H. J. (2004). Knowledge representation and reasoning. Morgan Kaufmann.
Cyganiak, R., & Reynolds, D. (Eds.). (2014). The RDF data cube vocabulary (W3C Recommendation). World Wide Web Consortium.
Cyganiak, R., Wood, D., & Lanthaler, M. (Eds.). (2014). RDF 1.1 concepts and abstract syntax (W3C Recommendation). World Wide Web Consortium.
Ehrlinger, L., & Wöß, W. (2016). Towards a definition of knowledge graphs. In Joint Proceedings of the Posters and Demos Track of the 12th International Conference on Semantic Systems (CEUR Workshop Proceedings, Vol. 1695). CEUR-WS.
Gruber, T. R. (1993). A translation approach to portable ontology specifications. Knowledge Acquisition, 5(2), 199–220. https://doi.org/10.1006/knac.1993.1008
Guha, R. V., Brickley, D., & Macbeth, S. (2016). Schema.org: Evolution of structured data on the web. Communications of the ACM, 59(2), 44–51. https://doi.org/10.1145/2844544
Heath, T., & Bizer, C. (2011). Linked data: Evolving the web into a global data space. Morgan & Claypool. https://doi.org/10.2200/S00334ED1V01Y201102WBE001
Hogan, A., Blomqvist, E., Cochez, M., d'Amato, C., de Melo, G., Gutierrez, C., Kirrane, S., Labra Gayo, J. E., Navigli, R., Neumaier, S., Ngonga Ngomo, A.-C., Polleres, A., Rashid, S. M., Rula, A., Schmelzeisen, L., Sequeda, J., Staab, S., & Zimmermann, A. (2021). Knowledge graphs. ACM Computing Surveys, 54(4), Article 71. https://doi.org/10.1145/3447772
Lenat, D. B. (1995). CYC: A large-scale investment in knowledge infrastructure. Communications of the ACM, 38(11), 33–38. https://doi.org/10.1145/219717.219745
Lewis, P., Perez, E., Piktus, A., Petroni, F., Karpukhin, V., Goyal, N., Küttler, H., Lewis, M., Yih, W., Rocktäschel, T., Riedel, S., & Kiela, D. (2020). Retrieval-augmented generation for knowledge-intensive NLP tasks. In Advances in Neural Information Processing Systems 33 (pp. 9459–9474). Curran Associates.
Noy, N., Gao, Y., Jain, A., Narayanan, A., Patterson, A., & Taylor, J. (2019). Industry-scale knowledge graphs: Lessons and challenges. Communications of the ACM, 62(8), 36–43. https://doi.org/10.1145/3331166
Pan, S., Luo, L., Wang, Y., Chen, C., Wang, J., & Wu, X. (2024). Unifying large language models and knowledge graphs: A roadmap. IEEE Transactions on Knowledge and Data Engineering, 36(7), 3580–3599. https://doi.org/10.1109/TKDE.2024.3352100
Paulheim, H. (2017). Knowledge graph refinement: A survey of approaches and evaluation methods. Semantic Web, 8(3), 489–508. https://doi.org/10.3233/SW-160218
Quillian, M. R. (1967). Word concepts: A theory and simulation of some basic semantic capabilities. Behavioral Science, 12(5), 410–430. https://doi.org/10.1002/bs.3830120511
Shadbolt, N., Hall, W., & Berners-Lee, T. (2006). The semantic web revisited. IEEE Intelligent Systems, 21(3), 96–101. https://doi.org/10.1109/MIS.2006.62
Singhal, A. (2012, May 16). Introducing the Knowledge Graph: Things, not strings. The Keyword, Google.
Vardigan, M., Heus, P., & Thomas, W. (2008). Data Documentation Initiative: Toward a standard for the social sciences. International Journal of Digital Curation, 3(1), 107–113. https://doi.org/10.2218/ijdc.v3i1.45
Vrandečić, D., & Krötzsch, M. (2014). Wikidata: A free collaborative knowledgebase. Communications of the ACM, 57(10), 78–85. https://doi.org/10.1145/2629489
Wilkinson, M. D., Dumontier, M., Aalbersberg, Ij. J., Appleton, G., Axton, M., Baak, A., Blomberg, N., Boiten, J.-W., da Silva Santos, L. B., Bourne, P. E., Bouwman, J., Brookes, A. J., Clark, T., Crosas, M., Dillo, I., Dumon, O., Edmunds, S., Evelo, C. T., Finkers, R., … Mons, B. (2016). The FAIR Guiding Principles for scientific data management and stewardship. Scientific Data, 3, Article 160018. https://doi.org/10.1038/sdata.2016.18