Surveys · Foundations and history
How the 1936 Literary Digest Poll Changed Survey Sampling Forever
The Literary Digest asked millions of Americans how they would vote in 1936 and got the answer badly wrong. Here is what went wrong and what survey research learned.
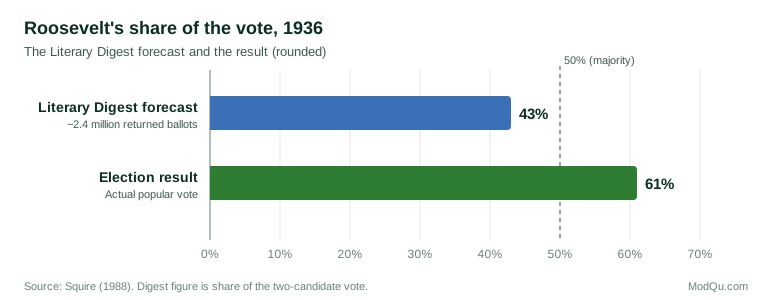
In the autumn of 1936 the Literary Digest, one of the most widely read magazines in the United States, announced that Alfred Landon would defeat President Franklin D. Roosevelt. Its forecast rested on roughly 2.4 million returned ballots, one of the largest opinion surveys ever conducted. A few weeks later Roosevelt won 46 of the 48 states and about 61% of the popular vote. The magazine never recovered its reputation and ceased publication soon afterwards. The episode became the classic lesson that the size of a sample matters far less than how it is drawn.
A record of success
The Digest had a strong track record. It had called the winner of every presidential election from 1916 to 1932 using "straw polls": mass mailings of postcard ballots to names taken from telephone directories, automobile registration lists, club memberships and its own subscriber rolls (Converse, 1987). In 1936 it mailed about ten million ballots. Around a quarter came back, and they showed Landon ahead by roughly 57% to 43% of the two-candidate vote (Squire, 1988).
What went wrong
The textbook explanation is that the mailing lists were biased towards wealthier Americans. In the middle of the Depression, households with telephones and cars were more prosperous than average and more likely to vote Republican. This coverage error meant the people who could be reached were not representative of the people who would vote.
Later research showed the story was more complicated. Bryson (1976) argued that the simple "rich people's lists" account had become a statistical myth repeated without evidence. Squire (1988) tested it directly using a 1937 Gallup survey that asked people whether they had received and returned a Digest ballot. He found that both problems were at work: the people who received ballots leaned towards Landon, and among those who received them, Landon supporters were more likely to send them back. Nonresponse bias compounded the coverage bias. Squire's analysis prompted further published debate (Cahalan, 1989). Lusinchi (2012) re-examined the evidence and also concluded that the mailing lists alone cannot account for the size of the error, and that the self-selection of respondents played a central role.
The lesson for every survey since is that a large sample does not cancel a biased one. Two million self-selected answers measured the opinions of the people who chose to answer, not the opinions of the electorate.
The statistics behind this are simple. Sampling error, the random variation that comes from studying a sample rather than everyone, shrinks as a sample grows. With more than two million ballots, the Digest's sampling error was a small fraction of a percentage point. Bias behaves differently. If the people in the sample differ systematically from the population, adding more of the same kind of people does not reduce the error at all; it only makes the wrong answer look more precise. The Digest's forecast was therefore both very precise and very wrong, missing Roosevelt's share by close to twenty points. Squire (1988) estimated that if everyone who received a ballot had returned it, the magazine would at least have picked the right winner, which shows how much of the damage was done by who chose to reply.
The rise of scientific polling
The same election made the reputations of a new generation of pollsters. George Gallup, Elmo Roper and Archibald Crossley used far smaller samples, chosen so that the people interviewed matched the population on characteristics such as region, age, sex and income. All of them forecast a Roosevelt victory, in direct contradiction of the Digest (Converse, 1987; Crossley, 1937). A much smaller but carefully constructed sample had outperformed a haphazard sample of millions.
This was not yet the end of the story. The new pollsters relied on quota sampling, in which interviewers chose whom to interview as long as they filled their quotas. Statisticians had already shown why that approach was risky. Neyman (1934) set out the mathematical case for probability sampling, in which every member of the population has a known, non-zero chance of selection, so that the accuracy of estimates can be calculated rather than hoped for. When quota-based polls wrongly forecast a Thomas Dewey victory over Harry Truman in 1948, American survey organisations moved decisively towards probability methods (Converse, 1987).
Why it still matters
The Digest problem has not gone away; it has changed form. Online opt-in panels, social media polls and website pop-ups can gather enormous numbers of responses quickly and cheaply. Like the Digest's postcards, they measure whoever happens to be reachable and willing. Modern survey practice responds in three ways:
- Know the frame. Ask who could possibly have been invited, and who could not.
- Measure and reduce nonresponse. Track who answers and who does not, and compare respondents with known population figures.
- Adjust honestly. Weight the results to known population totals, and report the uncertainty that remains (Lohr, 2021).
For a research company, the 1936 poll is a reminder that the value of survey data lies in the quality of the process behind it, not in the size of the headline number.
References
Bryson, M. C. (1976). The Literary Digest poll: Making of a statistical myth. The American Statistician, 30(4), 184–185. https://doi.org/10.1080/00031305.1976.10479173
Cahalan, D. (1989). Comment: The Digest poll rides again! Public Opinion Quarterly, 53(1), 129–133. https://doi.org/10.1086/269146
Converse, J. M. (1987). Survey research in the United States: Roots and emergence, 1890–1960. University of California Press.
Crossley, A. M. (1937). Straw polls in 1936. Public Opinion Quarterly, 1(1), 24–35. https://doi.org/10.1086/265035
Lohr, S. L. (2021). Sampling: Design and analysis (3rd ed.). CRC Press. https://doi.org/10.1201/9780429298899
Lusinchi, D. (2012). "President" Landon and the 1936 Literary Digest poll: Were automobile and telephone owners to blame? Social Science History, 36(1), 23–54. https://doi.org/10.1215/01455532-1461650
Neyman, J. (1934). On the two different aspects of the representative method: The method of stratified sampling and the method of purposive selection. Journal of the Royal Statistical Society, 97(4), 558–625. https://doi.org/10.2307/2342192
Squire, P. (1988). Why the 1936 Literary Digest poll failed. Public Opinion Quarterly, 52(1), 125–133. https://doi.org/10.1086/269085